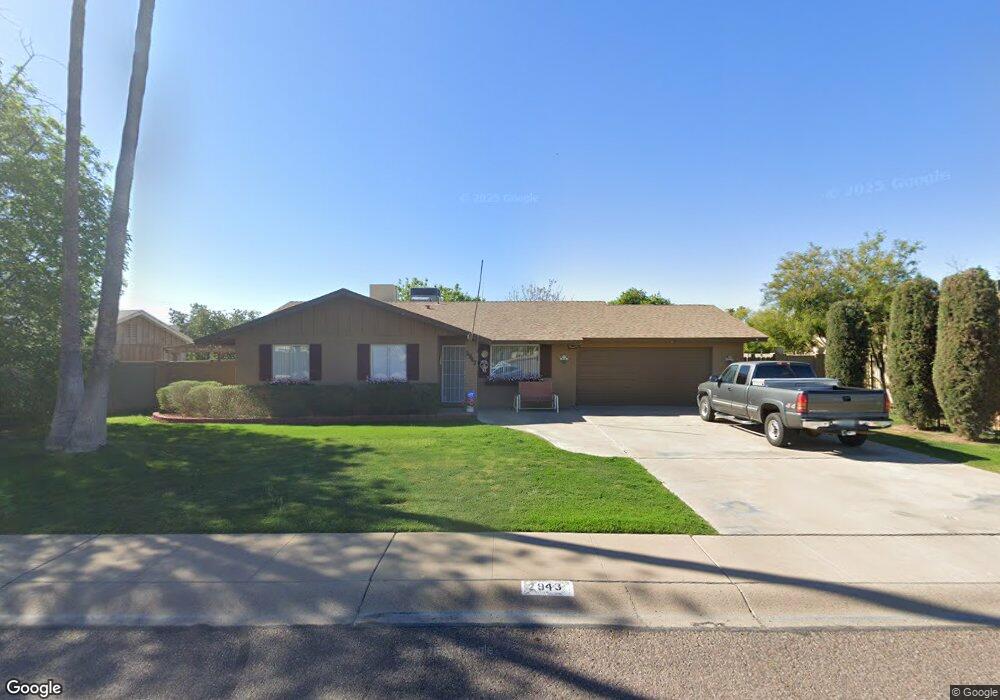
2943 E Sylvia St Phoenix, AZ 85032
Paradise Valley Village NeighborhoodEstimated Value: $386,524 - $512,000
Studio
2
Baths
1,588
Sq Ft
$300/Sq Ft
Est. Value
About This Home
This home is located at 2943 E Sylvia St, Phoenix, AZ 85032 and is currently estimated at $476,631, approximately $300 per square foot. 2943 E Sylvia St is a home located in Maricopa County with nearby schools including Larkspur Elementary School, Shea Middle School, and Shadow Mountain High School.
Ownership History
Date
Name
Owned For
Owner Type
Purchase Details
Closed on
Apr 3, 2020
Sold by
Meade Amanda J
Bought by
Meade James A
Current Estimated Value
Purchase Details
Closed on
Mar 24, 2020
Sold by
Meade Amanda J
Bought by
Meade James A
Purchase Details
Closed on
Nov 20, 2019
Sold by
Meade James A and Meade Phyllis A
Bought by
Meade James A and Meade Phyllis A
Purchase Details
Closed on
Aug 27, 2002
Sold by
Meade Amanda J
Bought by
Meade James A and Meade Phyllis A
Home Financials for this Owner
Home Financials are based on the most recent Mortgage that was taken out on this home.
Original Mortgage
$100,000
Interest Rate
6.22%
Purchase Details
Closed on
Oct 16, 2001
Sold by
Meade James A and Meade Phyllis A
Bought by
Meade James A and Meade Phyllis A
Create a Home Valuation Report for This Property
The Home Valuation Report is an in-depth analysis detailing your home's value as well as a comparison with similar homes in the area
Home Values in the Area
Average Home Value in this Area
Purchase History
| Date | Buyer | Sale Price | Title Company |
|---|---|---|---|
| Meade James A | -- | None Available | |
| Meade James A | -- | None Available | |
| Meade James A | -- | None Available | |
| Meade James A | -- | Grand Canyon Title Agency In | |
| Meade James A | -- | American Title Insurance |
Source: Public Records
Mortgage History
| Date | Status | Borrower | Loan Amount |
|---|---|---|---|
| Closed | Meade James A | $100,000 |
Source: Public Records
Tax History
| Year | Tax Paid | Tax Assessment Tax Assessment Total Assessment is a certain percentage of the fair market value that is determined by local assessors to be the total taxable value of land and additions on the property. | Land | Improvement |
|---|---|---|---|---|
| 2025 | $1,396 | $16,124 | -- | -- |
| 2024 | $1,329 | $15,356 | -- | -- |
| 2023 | $1,329 | $33,920 | $6,780 | $27,140 |
| 2022 | $1,317 | $26,720 | $5,340 | $21,380 |
| 2021 | $1,339 | $23,780 | $4,750 | $19,030 |
| 2020 | $1,293 | $22,610 | $4,520 | $18,090 |
| 2019 | $1,299 | $20,470 | $4,090 | $16,380 |
| 2018 | $1,251 | $18,720 | $3,740 | $14,980 |
| 2017 | $1,195 | $17,310 | $3,460 | $13,850 |
| 2016 | $1,176 | $16,550 | $3,310 | $13,240 |
| 2015 | $1,091 | $15,100 | $3,020 | $12,080 |
Source: Public Records
Map
Nearby Homes
- 2914 E Cactus Rd
- 3020 E Wethersfield Rd
- 2826 E Cactus Rd
- 2749 E Sylvia St
- 2741 E Sylvia St
- 11900 N 32nd St Unit 17
- 11900 N 32nd St Unit 29
- 3015 E Dahlia Dr
- 2707 E Shaw Butte Dr
- 3202 E Corrine Dr
- 3317 E Bloomfield Rd
- 2814 E Sierra St
- 3122 E Sierra St
- 2726 E Dahlia Dr
- 3106 E Cortez St
- 2843 E Cortez St
- 2813 E Cortez St
- 2801 E Cortez St
- 3224 E Sierra St
- 2808 E Lupine Ave
- 2937 E Sylvia St
- 2949 E Sylvia St
- 2942 E Cactus Rd
- 12401 N 29th Place
- 2931 E Sylvia St
- 3000 E Wethersfield Rd
- 2950 E Cactus Rd
- 12402 N 29th Place
- 2936 E Cactus Rd
- 12407 N 29th Place
- 3001 E Wethersfield Rd
- 2925 E Sylvia St
- 12408 N 29th Place
- 12408 N 29th Place
- 2926 E Cactus Rd
- 2930 E Cactus Rd
- 2928 E Sylvia St
- 3002 E Wethersfield Rd
- 12413 N 29th Place
- 12414 N 29th Place
Your Personal Tour Guide
Ask me questions while you tour the home.