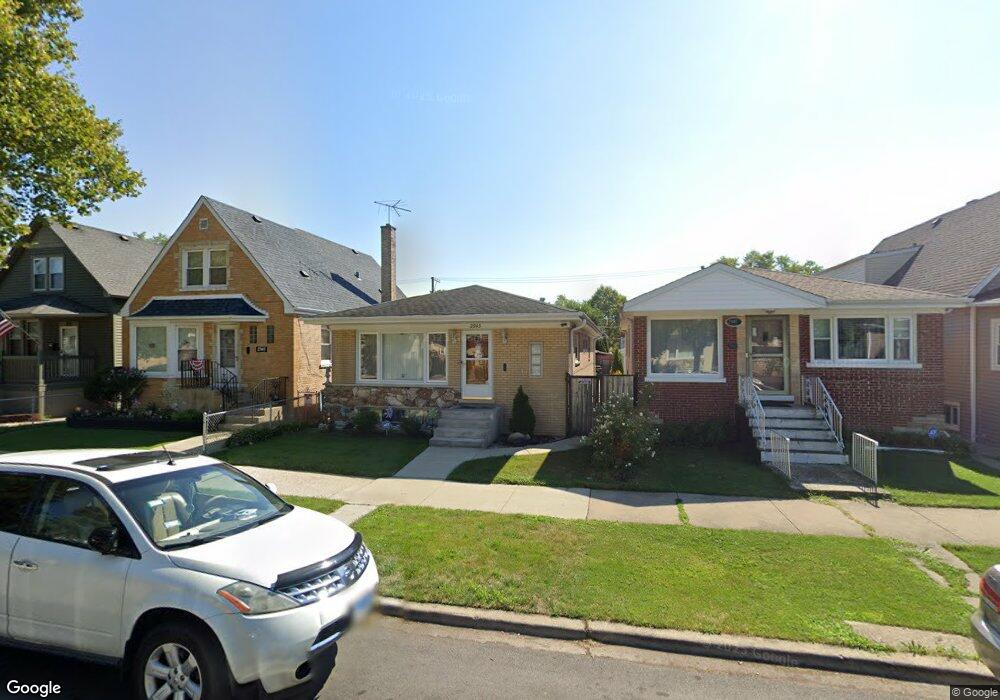
2943 N Rutherford Ave Chicago, IL 60634
Montclare NeighborhoodEstimated Value: $383,000 - $453,000
3
Beds
3
Baths
1,200
Sq Ft
$351/Sq Ft
Est. Value
About This Home
This home is located at 2943 N Rutherford Ave, Chicago, IL 60634 and is currently estimated at $421,076, approximately $350 per square foot. 2943 N Rutherford Ave is a home located in Cook County with nearby schools including Locke J Elementary School, Steinmetz College Prep, and Icci Academy.
Ownership History
Date
Name
Owned For
Owner Type
Purchase Details
Closed on
Feb 5, 2013
Sold by
Diaz Mireya and Vega Mireya
Bought by
Vega Mireya and Vega Gudalupe
Current Estimated Value
Home Financials for this Owner
Home Financials are based on the most recent Mortgage that was taken out on this home.
Original Mortgage
$253,561
Outstanding Balance
$175,936
Interest Rate
3.25%
Mortgage Type
FHA
Estimated Equity
$245,140
Purchase Details
Closed on
Jan 4, 2010
Sold by
Parkway Bank & Trust Company
Bought by
Diaz Mireya
Home Financials for this Owner
Home Financials are based on the most recent Mortgage that was taken out on this home.
Original Mortgage
$265,109
Interest Rate
4.87%
Mortgage Type
FHA
Purchase Details
Closed on
Aug 3, 2002
Sold by
Chmiel Henry K and Majka Maria
Bought by
Parkway Bank & Trust Company and Trust #13353
Purchase Details
Closed on
Apr 16, 2002
Sold by
Moleski Steve
Bought by
Majka Maria and Chmiel Henryk
Create a Home Valuation Report for This Property
The Home Valuation Report is an in-depth analysis detailing your home's value as well as a comparison with similar homes in the area
Home Values in the Area
Average Home Value in this Area
Purchase History
| Date | Buyer | Sale Price | Title Company |
|---|---|---|---|
| Vega Mireya | -- | None Available | |
| Diaz Mireya | $270,000 | Saturn Title | |
| Parkway Bank & Trust Company | -- | -- | |
| Majka Maria | -- | First American Title |
Source: Public Records
Mortgage History
| Date | Status | Borrower | Loan Amount |
|---|---|---|---|
| Open | Vega Mireya | $253,561 | |
| Closed | Diaz Mireya | $265,109 |
Source: Public Records
Tax History Compared to Growth
Tax History
| Year | Tax Paid | Tax Assessment Tax Assessment Total Assessment is a certain percentage of the fair market value that is determined by local assessors to be the total taxable value of land and additions on the property. | Land | Improvement |
|---|---|---|---|---|
| 2024 | $4,649 | $29,313 | $11,625 | $17,688 |
| 2023 | $4,510 | $25,336 | $9,375 | $15,961 |
| 2022 | $4,510 | $25,336 | $9,375 | $15,961 |
| 2021 | $4,853 | $27,447 | $9,375 | $18,072 |
| 2020 | $3,704 | $19,721 | $4,687 | $15,034 |
| 2019 | $3,765 | $22,159 | $4,687 | $17,472 |
| 2018 | $3,701 | $22,159 | $4,687 | $17,472 |
| 2017 | $4,234 | $23,034 | $4,125 | $18,909 |
| 2016 | $4,116 | $23,034 | $4,125 | $18,909 |
| 2015 | $3,742 | $23,034 | $4,125 | $18,909 |
| 2014 | $3,838 | $23,241 | $3,750 | $19,491 |
| 2013 | $3,751 | $23,241 | $3,750 | $19,491 |
Source: Public Records
Map
Nearby Homes
- 3011 N Oak Park Ave
- 6559 W George St Unit 506
- 3121 N Normandy Ave
- 2930 N New England Ave
- 3120 N Natoma Ave
- 2747 N Oak Park Ave
- 6556 W Barry Ave Unit E
- 3111 N Nashville Ave Unit 1E
- 6934 W Oakdale Ave
- 6643 W Belmont Ave Unit 1
- 6653 W Belmont Ave
- 6565 W Belmont Ave Unit 104N
- 6736 W Belmont Ave
- 2712 N Oak Park Ave
- 6938 W Barry Ave
- 3020 N Nagle Ave
- 6944 W Diversey Ave Unit 3S
- 3034 N Nagle Ave
- 2714 N New England Ave
- 6616 W Melrose St
- 2941 N Rutherford Ave
- 2945 N Rutherford Ave
- 2937 N Rutherford Ave
- 2929 N Rutherford Ave
- 2931 N Rutherford Ave
- 2929 N Rutherford Ave
- 2955 N Rutherford Ave
- 2942 N Normandy Ave
- 2946 N Normandy Ave
- 2940 N Normandy Ave
- 2925 N Rutherford Ave
- 2959 N Rutherford Ave
- 2948 N Normandy Ave
- 2936 N Normandy Ave
- 2952 N Normandy Ave
- 2934 N Normandy Ave
- 2923 N Rutherford Ave
- 2956 N Normandy Ave
- 2930 N Normandy Ave