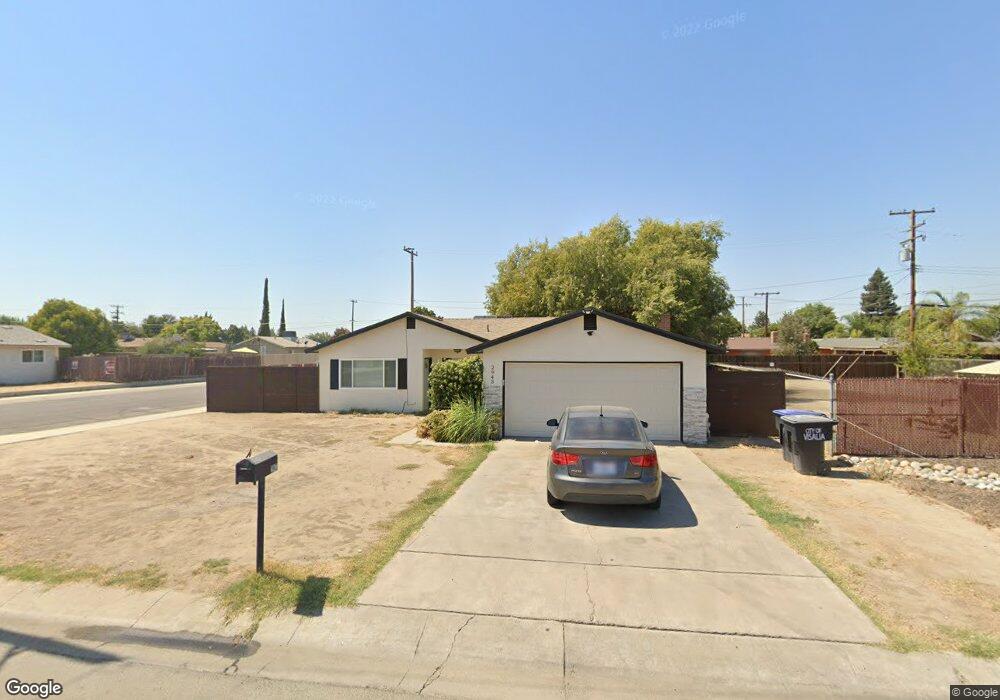
2943 S Bollinger St Visalia, CA 93277
Estimated Value: $324,000 - $344,000
3
Beds
2
Baths
1,318
Sq Ft
$251/Sq Ft
Est. Value
About This Home
This home is located at 2943 S Bollinger St, Visalia, CA 93277 and is currently estimated at $331,191, approximately $251 per square foot. 2943 S Bollinger St is a home located in Tulare County with nearby schools including Linwood Elementary School, La Joya Middle School, and El Diamante High School.
Ownership History
Date
Name
Owned For
Owner Type
Purchase Details
Closed on
Mar 30, 2022
Sold by
Teodo Holdings Llc
Bought by
Teodo 4 Llc
Current Estimated Value
Home Financials for this Owner
Home Financials are based on the most recent Mortgage that was taken out on this home.
Original Mortgage
$1,099,000
Outstanding Balance
$1,034,142
Interest Rate
4.42%
Mortgage Type
New Conventional
Estimated Equity
-$702,951
Purchase Details
Closed on
Aug 25, 2016
Sold by
Espinoza Diego Daniel
Bought by
Teodo Holdings Llc
Purchase Details
Closed on
Sep 22, 2010
Sold by
Meek Kimberly D
Bought by
Espinoza Diego Daniel
Home Financials for this Owner
Home Financials are based on the most recent Mortgage that was taken out on this home.
Original Mortgage
$64,944
Interest Rate
4.33%
Mortgage Type
New Conventional
Purchase Details
Closed on
Oct 1, 2002
Sold by
Meek Rosanne
Bought by
Meek Kimberly D
Create a Home Valuation Report for This Property
The Home Valuation Report is an in-depth analysis detailing your home's value as well as a comparison with similar homes in the area
Home Values in the Area
Average Home Value in this Area
Purchase History
| Date | Buyer | Sale Price | Title Company |
|---|---|---|---|
| Teodo 4 Llc | -- | Servicelink Title | |
| Teodo Holdings Llc | -- | None Available | |
| Espinoza Diego Daniel | $81,500 | Chicago Title Company | |
| Meek Kimberly D | -- | -- |
Source: Public Records
Mortgage History
| Date | Status | Borrower | Loan Amount |
|---|---|---|---|
| Open | Teodo 4 Llc | $1,099,000 | |
| Previous Owner | Espinoza Diego Daniel | $64,944 |
Source: Public Records
Tax History Compared to Growth
Tax History
| Year | Tax Paid | Tax Assessment Tax Assessment Total Assessment is a certain percentage of the fair market value that is determined by local assessors to be the total taxable value of land and additions on the property. | Land | Improvement |
|---|---|---|---|---|
| 2025 | $1,961 | $185,690 | $46,422 | $139,268 |
| 2024 | $1,961 | $182,050 | $45,512 | $136,538 |
| 2023 | $1,908 | $178,481 | $44,620 | $133,861 |
| 2022 | $1,822 | $174,983 | $43,746 | $131,237 |
| 2021 | $1,825 | $171,552 | $42,888 | $128,664 |
| 2020 | $1,808 | $169,793 | $42,448 | $127,345 |
| 2019 | $1,758 | $166,464 | $41,616 | $124,848 |
| 2018 | $957 | $91,204 | $45,039 | $46,165 |
| 2017 | $953 | $89,416 | $44,156 | $45,260 |
| 2016 | $929 | $87,663 | $43,290 | $44,373 |
| 2015 | $929 | $86,346 | $42,640 | $43,706 |
| 2014 | $903 | $84,655 | $41,805 | $42,850 |
Source: Public Records
Map
Nearby Homes
- 2801 S Kent Ct
- 4523 W Evergreen Ct
- 2223 S Julieann St Unit 1032v
- 2346 S Julieann St Unit 1067v
- 2650 S Chinowth St
- 4239 W Mary Ave
- 4746 W Ashland Ave
- 3131 S Parkwood St
- 3737 W Victor Ave
- 2826 S Avocado Ct
- 5141 W Chestnut Ave
- 3924 W Fairhaven Ave
- 4218 W Redding Ave
- 0 S Silvervale Unit 231829
- 4105 W Concord Ct
- 4301 S University St
- 4038 S Atwood St
- 4036 W Rialto Ave
- 3504 W Cutler Ave
- 3933 S Parkwood St
- 3009 S Bollinger St
- 2940 S Linwood St
- 2919 S Bollinger St
- 2932 S Linwood St
- 3010 S Linwood St
- 2926 S Linwood St
- 3019 S Bollinger St
- 2911 S Bollinger St
- 4345 W La Vida Ave
- 4334 W La Vida Ave
- 3020 S Linwood St
- 4347 W Monte Vista Ave
- 2914 S Linwood St
- 3029 S Bollinger St
- 4335 W La Vida Ave
- 4337 W Monte Vista Ave
- 2901 S Bollinger St
- 3030 S Linwood St
- 4324 W La Vida Ave
- 2902 S Linwood St