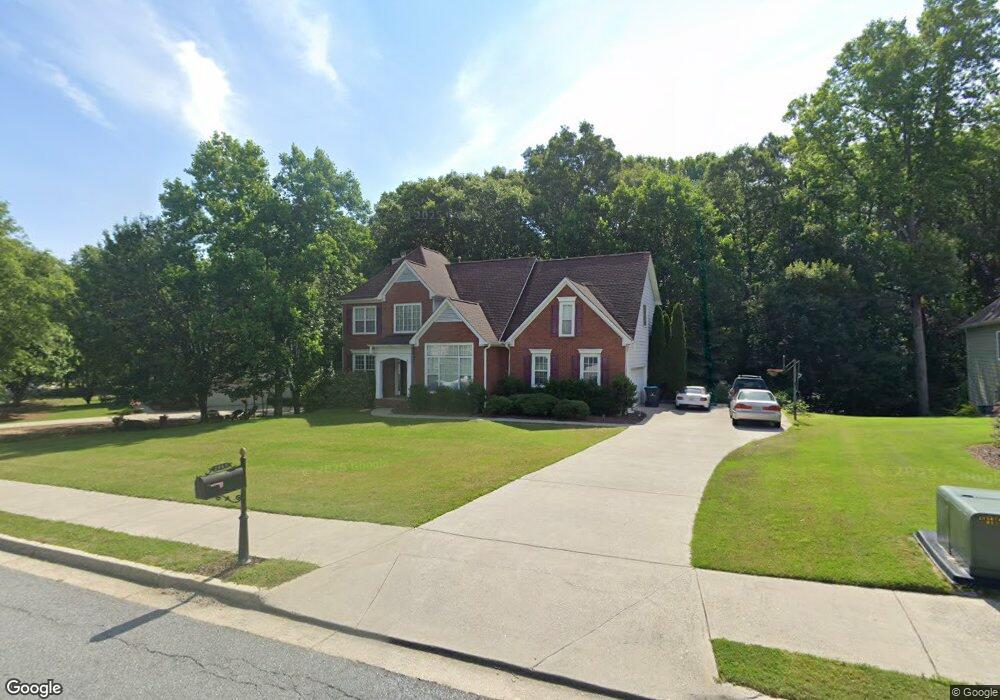
2945 Barimore Place Unit 35 Dacula, GA 30019
Estimated Value: $461,000 - $489,000
4
Beds
4
Baths
3,128
Sq Ft
$151/Sq Ft
Est. Value
About This Home
This home is located at 2945 Barimore Place Unit 35, Dacula, GA 30019 and is currently estimated at $471,822, approximately $150 per square foot. 2945 Barimore Place Unit 35 is a home located in Gwinnett County with nearby schools including Harbins Elementary School, McConnell Middle School, and Archer High School.
Ownership History
Date
Name
Owned For
Owner Type
Purchase Details
Closed on
Jul 31, 2025
Sold by
Barker Coleman L
Bought by
Myers Jefferson and Odonovan James Augustine
Current Estimated Value
Home Financials for this Owner
Home Financials are based on the most recent Mortgage that was taken out on this home.
Original Mortgage
$265,000
Outstanding Balance
$264,768
Interest Rate
6.67%
Mortgage Type
New Conventional
Estimated Equity
$207,054
Purchase Details
Closed on
May 3, 2013
Sold by
Bursee Thomas
Bought by
Barker Coleman L
Home Financials for this Owner
Home Financials are based on the most recent Mortgage that was taken out on this home.
Original Mortgage
$194,904
Interest Rate
3.25%
Mortgage Type
FHA
Purchase Details
Closed on
Apr 24, 2012
Sold by
Dursee Thomas Living Trust
Bought by
Bursee Thomas
Home Financials for this Owner
Home Financials are based on the most recent Mortgage that was taken out on this home.
Original Mortgage
$167,400
Interest Rate
4.01%
Mortgage Type
New Conventional
Purchase Details
Closed on
Jun 13, 2003
Sold by
Northstar Homes Llc
Bought by
Dursee Tom F
Home Financials for this Owner
Home Financials are based on the most recent Mortgage that was taken out on this home.
Original Mortgage
$191,900
Interest Rate
5.56%
Mortgage Type
New Conventional
Create a Home Valuation Report for This Property
The Home Valuation Report is an in-depth analysis detailing your home's value as well as a comparison with similar homes in the area
Home Values in the Area
Average Home Value in this Area
Purchase History
| Date | Buyer | Sale Price | Title Company |
|---|---|---|---|
| Myers Jefferson | $465,000 | -- | |
| Barker Coleman L | $198,500 | -- | |
| Bursee Thomas | -- | -- | |
| Dursee Tom F | $239,900 | -- |
Source: Public Records
Mortgage History
| Date | Status | Borrower | Loan Amount |
|---|---|---|---|
| Open | Myers Jefferson | $265,000 | |
| Previous Owner | Barker Coleman L | $194,904 | |
| Previous Owner | Bursee Thomas | $167,400 | |
| Previous Owner | Dursee Tom F | $191,900 |
Source: Public Records
Tax History Compared to Growth
Tax History
| Year | Tax Paid | Tax Assessment Tax Assessment Total Assessment is a certain percentage of the fair market value that is determined by local assessors to be the total taxable value of land and additions on the property. | Land | Improvement |
|---|---|---|---|---|
| 2025 | $6,506 | $223,920 | $30,000 | $193,920 |
| 2024 | $6,376 | $209,880 | $30,000 | $179,880 |
| 2023 | $6,376 | $228,280 | $34,000 | $194,280 |
| 2022 | $5,730 | $180,160 | $30,400 | $149,760 |
| 2021 | $5,068 | $144,520 | $20,000 | $124,520 |
| 2020 | $5,102 | $144,520 | $20,000 | $124,520 |
| 2019 | $4,720 | $134,560 | $20,000 | $114,560 |
| 2018 | $4,704 | $123,840 | $18,400 | $105,440 |
| 2016 | $4,204 | $109,120 | $12,800 | $96,320 |
| 2015 | $4,249 | $109,120 | $12,800 | $96,320 |
| 2014 | $3,212 | $79,400 | $10,800 | $68,600 |
Source: Public Records
Map
Nearby Homes
- 1401 Barimore Ct
- 3126 Cove View Ct
- 3126 Cove View Ct SE
- 1737 Rolling View Way
- 3137 Cove View Ct
- 1476 Rolling View Way
- 2760 Jona Trail
- 1365 Slate Bend Dr
- 1354 Slate Bend Dr
- 2920 Williams Farm Dr
- 2960 Williams Farm Dr
- 2650 Harbins Mill Dr
- 1350 Whitley Rd
- 1845 Country Crest Way
- 1432 Armende Cir
- 1314 Bentley Estates Dr
- 2827 James Henry Dr
- 2622 Sam Calvin Dr
- 2935 Barimore Place
- 2955 Barimore Place
- 2925 Barimore Place
- 2950 Barimore Place Unit 20
- 2950 Barimore Place
- 2975 Barimore Place
- 2940 Barimore Place
- 2960 Barimore Place
- 2915 Barimore Place
- 1411 Barimore Ct
- 2870 Barimore Place
- 2860 Barimore Place
- 2985 Barimore Place
- 2905 Barimore Place
- 2905 Barimore Place Unit 39
- 2970 Barimore Place Unit 1
- 1412 Barimore Ct
- 2850 Barimore Place
- 2032 Windsor Park Ave
- 2052 Windsor Park Ave