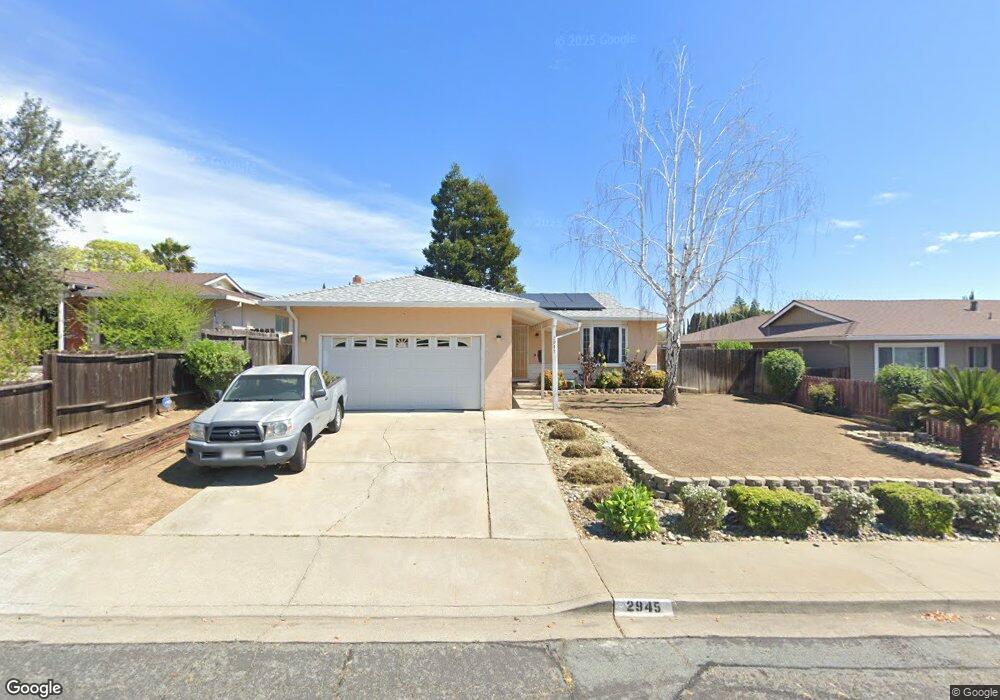
2945 Los Altos Way Antioch, CA 94509
Contra Loma NeighborhoodEstimated Value: $522,000 - $588,000
3
Beds
2
Baths
1,245
Sq Ft
$440/Sq Ft
Est. Value
About This Home
This home is located at 2945 Los Altos Way, Antioch, CA 94509 and is currently estimated at $547,354, approximately $439 per square foot. 2945 Los Altos Way is a home located in Contra Costa County with nearby schools including Mission Elementary School, Park Middle School, and Antioch High School.
Ownership History
Date
Name
Owned For
Owner Type
Purchase Details
Closed on
Apr 8, 2004
Sold by
Smith Michael S and Davidson Tracie J
Bought by
Parra Ruben and Parra Elizabeth
Current Estimated Value
Home Financials for this Owner
Home Financials are based on the most recent Mortgage that was taken out on this home.
Original Mortgage
$276,000
Outstanding Balance
$131,782
Interest Rate
5.87%
Mortgage Type
Purchase Money Mortgage
Estimated Equity
$415,572
Purchase Details
Closed on
May 16, 2002
Sold by
Staggs Ruby Irene
Bought by
Smith Michael S and Davidson Tracie J
Home Financials for this Owner
Home Financials are based on the most recent Mortgage that was taken out on this home.
Original Mortgage
$265,000
Interest Rate
7.13%
Mortgage Type
Stand Alone First
Purchase Details
Closed on
Feb 10, 2000
Sold by
Fenichel Barbara Tre
Bought by
Staggs Ruby Irene
Home Financials for this Owner
Home Financials are based on the most recent Mortgage that was taken out on this home.
Original Mortgage
$126,000
Interest Rate
8.06%
Mortgage Type
Stand Alone First
Create a Home Valuation Report for This Property
The Home Valuation Report is an in-depth analysis detailing your home's value as well as a comparison with similar homes in the area
Home Values in the Area
Average Home Value in this Area
Purchase History
| Date | Buyer | Sale Price | Title Company |
|---|---|---|---|
| Parra Ruben | $347,000 | First American Title | |
| Smith Michael S | $265,000 | First American Title Guarant | |
| Staggs Ruby Irene | $157,500 | Alliance Title Company |
Source: Public Records
Mortgage History
| Date | Status | Borrower | Loan Amount |
|---|---|---|---|
| Open | Parra Ruben | $276,000 | |
| Previous Owner | Smith Michael S | $265,000 | |
| Previous Owner | Staggs Ruby Irene | $126,000 | |
| Closed | Parra Ruben | $69,000 |
Source: Public Records
Tax History Compared to Growth
Tax History
| Year | Tax Paid | Tax Assessment Tax Assessment Total Assessment is a certain percentage of the fair market value that is determined by local assessors to be the total taxable value of land and additions on the property. | Land | Improvement |
|---|---|---|---|---|
| 2025 | $5,964 | $501,873 | $227,478 | $274,395 |
| 2024 | $5,811 | $492,033 | $223,018 | $269,015 |
| 2023 | $5,811 | $482,387 | $218,646 | $263,741 |
| 2022 | $5,718 | $472,929 | $214,359 | $258,570 |
| 2021 | $4,807 | $401,000 | $181,757 | $219,243 |
| 2019 | $4,291 | $348,000 | $157,734 | $190,266 |
| 2018 | $4,027 | $331,000 | $150,029 | $180,971 |
| 2017 | $3,467 | $283,000 | $128,272 | $154,728 |
| 2016 | $3,415 | $280,000 | $126,913 | $153,087 |
| 2015 | $3,009 | $242,500 | $109,915 | $132,585 |
| 2014 | $2,302 | $182,500 | $82,720 | $99,780 |
Source: Public Records
Map
Nearby Homes
- 2928 El Monte Way
- 2948 Palo Verde Way
- 3019 El Monte Ct
- 2924 Ventura Ct
- 3026 El Monte Ct
- 2921 Lucena Way
- 1618 Putnam St
- 1205 Putnam St
- 2800 Seville Cir
- 1746 San Jose Dr
- 2117 Lopez Dr
- 3163 S Francisco Way
- 3326 Hacienda Way
- 3366 S Francisco Way
- 1412 Buchanan Rd
- 1810 San Jose Dr
- 2508 Princeton Ln
- 2504 Bishop Ln
- 1904 San Jose Dr
- 2005 San Jose Dr
- 2949 Los Altos Way
- 2941 Los Altos Way
- 2932 El Monte Way
- 2936 El Monte Way
- 2953 Los Altos Way
- 2937 Los Altos Way
- 2940 El Monte Way
- 2944 Los Altos Way
- 2948 Los Altos Way
- 2957 Los Altos Way
- 2944 El Monte Way
- 2933 Los Altos Way
- 2924 El Monte Way
- 2940 Los Altos Way
- 2952 Los Altos Way
- 2936 Los Altos Way
- 2956 Los Altos Way
- 2948 El Monte Way
- 2961 Los Altos Way
- 2927 Los Altos Way