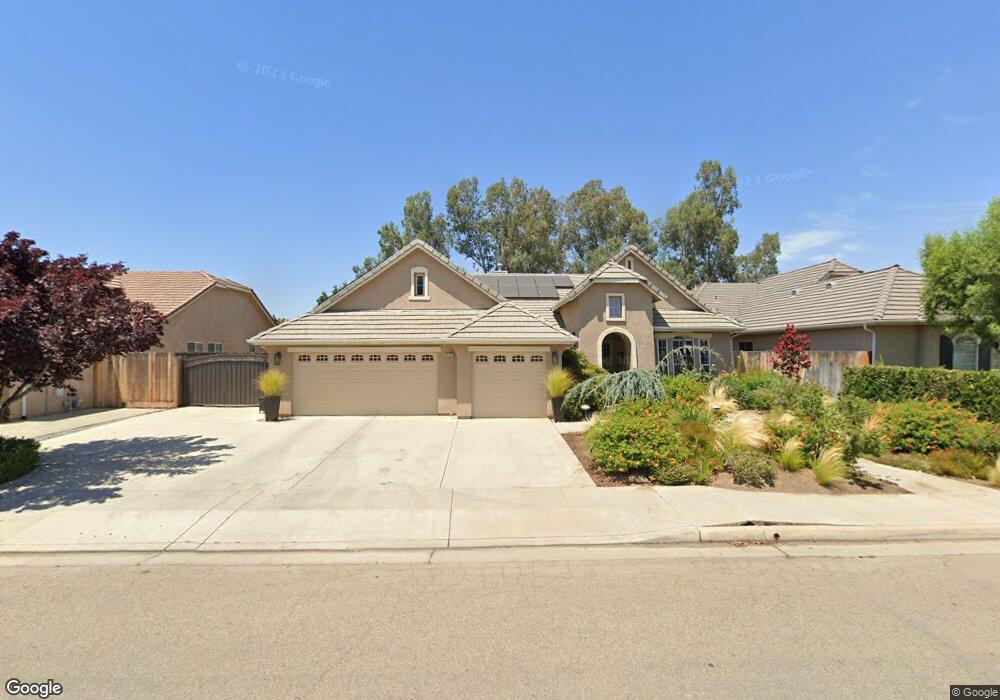
2945 Richert Ave Clovis, CA 93611
Estimated Value: $637,000 - $642,908
3
Beds
2
Baths
2,587
Sq Ft
$247/Sq Ft
Est. Value
About This Home
This home is located at 2945 Richert Ave, Clovis, CA 93611 and is currently estimated at $639,303, approximately $247 per square foot. 2945 Richert Ave is a home located in Fresno County with nearby schools including Freedom Elementary School, Reyburn Intermediate School, and Clovis East High School.
Ownership History
Date
Name
Owned For
Owner Type
Purchase Details
Closed on
Nov 11, 2010
Sold by
Weibert Gregory E and Weibert Jayne
Bought by
Beardsley Ii Gerald Wayne and Beardsley Annette
Current Estimated Value
Home Financials for this Owner
Home Financials are based on the most recent Mortgage that was taken out on this home.
Original Mortgage
$355,482
Interest Rate
4.35%
Mortgage Type
VA
Purchase Details
Closed on
Jun 27, 2006
Sold by
Weibert Greg and Weibert Jayne
Bought by
Weibert Gregory E and Weibert Jayne
Purchase Details
Closed on
Mar 31, 2003
Sold by
Leo Wilson Co Inc
Bought by
Weibert Greg and Weibert Jayne
Home Financials for this Owner
Home Financials are based on the most recent Mortgage that was taken out on this home.
Original Mortgage
$140,000
Interest Rate
5.78%
Create a Home Valuation Report for This Property
The Home Valuation Report is an in-depth analysis detailing your home's value as well as a comparison with similar homes in the area
Home Values in the Area
Average Home Value in this Area
Purchase History
| Date | Buyer | Sale Price | Title Company |
|---|---|---|---|
| Beardsley Ii Gerald Wayne | $375,000 | Fidelity National Title Co | |
| Weibert Gregory E | -- | None Available | |
| Weibert Greg | $273,500 | Financial Title Company |
Source: Public Records
Mortgage History
| Date | Status | Borrower | Loan Amount |
|---|---|---|---|
| Previous Owner | Beardsley Ii Gerald Wayne | $355,482 | |
| Previous Owner | Weibert Greg | $140,000 |
Source: Public Records
Tax History
| Year | Tax Paid | Tax Assessment Tax Assessment Total Assessment is a certain percentage of the fair market value that is determined by local assessors to be the total taxable value of land and additions on the property. | Land | Improvement |
|---|---|---|---|---|
| 2025 | $5,374 | $448,398 | $134,516 | $313,882 |
| 2023 | $5,158 | $430,989 | $129,294 | $301,695 |
| 2022 | $5,090 | $422,539 | $126,759 | $295,780 |
| 2021 | $4,949 | $414,255 | $124,274 | $289,981 |
| 2020 | $4,930 | $410,008 | $123,000 | $287,008 |
| 2019 | $4,836 | $401,970 | $120,589 | $281,381 |
| 2018 | $4,732 | $394,089 | $118,225 | $275,864 |
| 2017 | $4,639 | $386,362 | $115,907 | $270,455 |
| 2016 | $4,485 | $378,787 | $113,635 | $265,152 |
| 2015 | $4,417 | $373,099 | $111,929 | $261,170 |
| 2014 | $4,336 | $365,792 | $109,737 | $256,055 |
Source: Public Records
Map
Nearby Homes
- 2888 Ashcroft Ave
- 3046 Indianapolis Ave
- 3031 Glacier Ln
- 2735 Swift Ave
- 2721 Holland Ave
- 2914 Blackwood Ave
- 3001 Pico Ave
- 2885 Blackwood Ave
- 2614 Indianapolis Ave
- 2722 Park Ave
- 2836 Griffith Ave
- 3350 Buckingham Ave
- 3357 Buckingham Ave
- 2506 Swift Ave
- 2853 Carolina Ave
- 7478 E Flint Way
- 2631 Rall Ave
- 2449 Lombard Ln
- 2459 Lombard Ln
- 2318 Lombard Ln
- 2925 Richert Ave
- 2955 Richert Ave
- 2915 Richert Ave
- 2965 Richert Ave
- 2946 Richert Ave
- 2926 Richert Ave
- 2975 Richert Ave
- 2956 Richert Ave
- 2916 Richert Ave
- 2970 Locan Ave
- 2966 Richert Ave
- 2906 Richert Ave
- 2885 Richert Ave
- 2995 Richert Ave
- 2976 Richert Ave
- 2896 Richert Ave
- 2949 Swift Ave
- 2929 Swift Ave
- 2959 Swift Ave
- 2930 Locan Ave
Your Personal Tour Guide
Ask me questions while you tour the home.