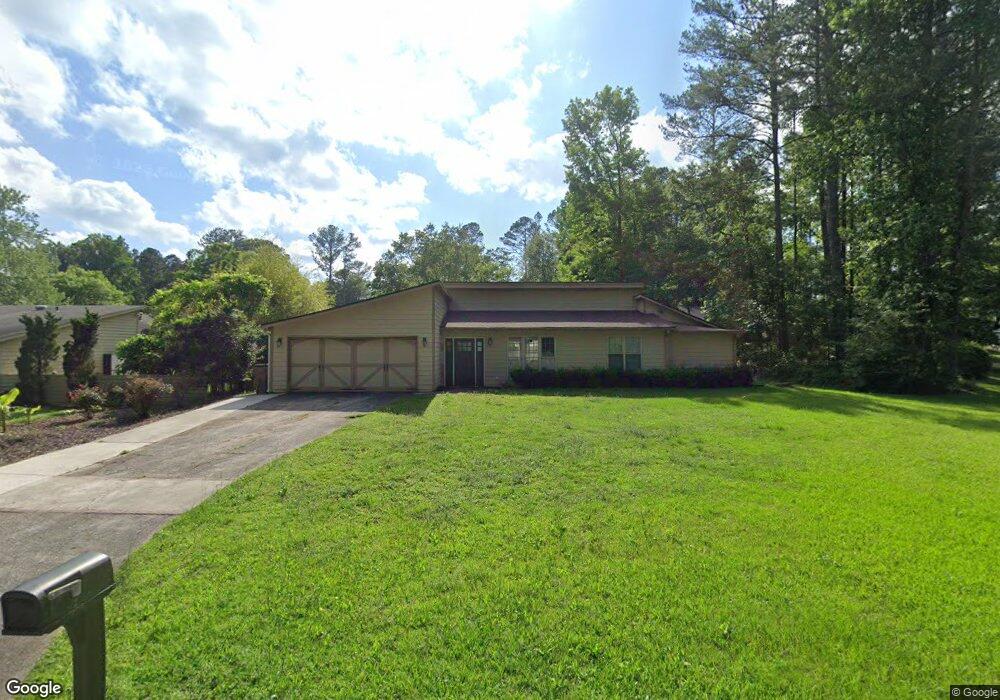
2947 Christophers Ct Marietta, GA 30062
East Cobb NeighborhoodEstimated Value: $400,000 - $450,000
4
Beds
3
Baths
1,764
Sq Ft
$241/Sq Ft
Est. Value
About This Home
This home is located at 2947 Christophers Ct, Marietta, GA 30062 and is currently estimated at $424,543, approximately $240 per square foot. 2947 Christophers Ct is a home located in Cobb County with nearby schools including Mountain View Elementary School, Simpson Middle School, and Sprayberry High School.
Ownership History
Date
Name
Owned For
Owner Type
Purchase Details
Closed on
Jul 30, 2010
Sold by
Roshan Saraya
Bought by
Johnston Kimberly E
Current Estimated Value
Home Financials for this Owner
Home Financials are based on the most recent Mortgage that was taken out on this home.
Original Mortgage
$167,741
Outstanding Balance
$109,499
Interest Rate
4.37%
Mortgage Type
FHA
Estimated Equity
$315,044
Purchase Details
Closed on
Apr 14, 2009
Sold by
Cwabs Inc Series 2007-Bc2
Bought by
Roshan Saraya
Purchase Details
Closed on
Mar 4, 2008
Sold by
Marquina Enrique A and Marquina Maria A
Bought by
Bank Of New York
Purchase Details
Closed on
May 19, 2000
Sold by
Rosenblatt Michaela M
Bought by
Marquina Enrique A
Home Financials for this Owner
Home Financials are based on the most recent Mortgage that was taken out on this home.
Original Mortgage
$118,027
Interest Rate
8.23%
Mortgage Type
FHA
Create a Home Valuation Report for This Property
The Home Valuation Report is an in-depth analysis detailing your home's value as well as a comparison with similar homes in the area
Home Values in the Area
Average Home Value in this Area
Purchase History
| Date | Buyer | Sale Price | Title Company |
|---|---|---|---|
| Johnston Kimberly E | $170,000 | -- | |
| Roshan Saraya | $65,000 | -- | |
| Bank Of New York | $153,900 | -- | |
| Marquina Enrique A | $119,000 | -- |
Source: Public Records
Mortgage History
| Date | Status | Borrower | Loan Amount |
|---|---|---|---|
| Open | Johnston Kimberly E | $167,741 | |
| Previous Owner | Marquina Enrique A | $118,027 |
Source: Public Records
Tax History Compared to Growth
Tax History
| Year | Tax Paid | Tax Assessment Tax Assessment Total Assessment is a certain percentage of the fair market value that is determined by local assessors to be the total taxable value of land and additions on the property. | Land | Improvement |
|---|---|---|---|---|
| 2025 | $3,963 | $168,432 | $36,000 | $132,432 |
| 2024 | $3,966 | $168,432 | $36,000 | $132,432 |
| 2023 | $2,802 | $139,804 | $36,000 | $103,804 |
| 2022 | $3,034 | $124,428 | $24,000 | $100,428 |
| 2021 | $2,452 | $97,832 | $24,000 | $73,832 |
| 2020 | $2,280 | $89,968 | $24,000 | $65,968 |
| 2019 | $1,990 | $76,696 | $18,000 | $58,696 |
| 2018 | $1,990 | $76,696 | $18,000 | $58,696 |
| 2017 | $1,986 | $69,068 | $14,400 | $54,668 |
| 2016 | $1,986 | $69,068 | $14,400 | $54,668 |
| 2015 | $1,285 | $43,620 | $12,000 | $31,620 |
| 2014 | $1,296 | $43,620 | $0 | $0 |
Source: Public Records
Map
Nearby Homes
- 2422 Salem Dr NE
- 2321 Post Creek Ct
- 2747 Harper Woods Dr
- 3006 Alberta Dr
- 2243 Rosemoore Walk
- 2671 Nicholas Ct NE
- 3060 Sandy Plains Rd
- 2919 Manitoba Ln
- 2230 Concord Square NE
- 2641 Nicholas Ct NE
- 2998 Kodiak Ct
- 3061 Sandy Plains Rd
- 3090 Trickum Rd NE
- 3122 Vandiver Dr
- 2170 Beaver Shop Rd
- 2686 Evers Dr NE
- 2690 Evers Dr
- 2694 Evers Dr
- 1927 Redfield Rd
- 2371 Salem Dr NE Unit 4
- 2361 Salem Dr NE
- 2949 Christophers Ct
- 2950 Christophers Ct
- 2391 Salem Dr NE
- 2351 Salem Dr NE
- 2953 Christophers Ct
- 2954 Christophers Ct
- 2808 Post Oak Dr
- 2401 Salem Dr NE
- 2325 Danielle Ct
- 2323 Danielle Ct
- 2323 Danielle Ct Unit 2
- 2341 Salem Dr NE Unit 2
- 2350 Salem Dr NE
- 2390 Salem Dr NE
- 2958 Christophers Ct
- 2975 Sloans Way
- 2321 Danielle Ct
- 0 Sloans Way Unit 7108711