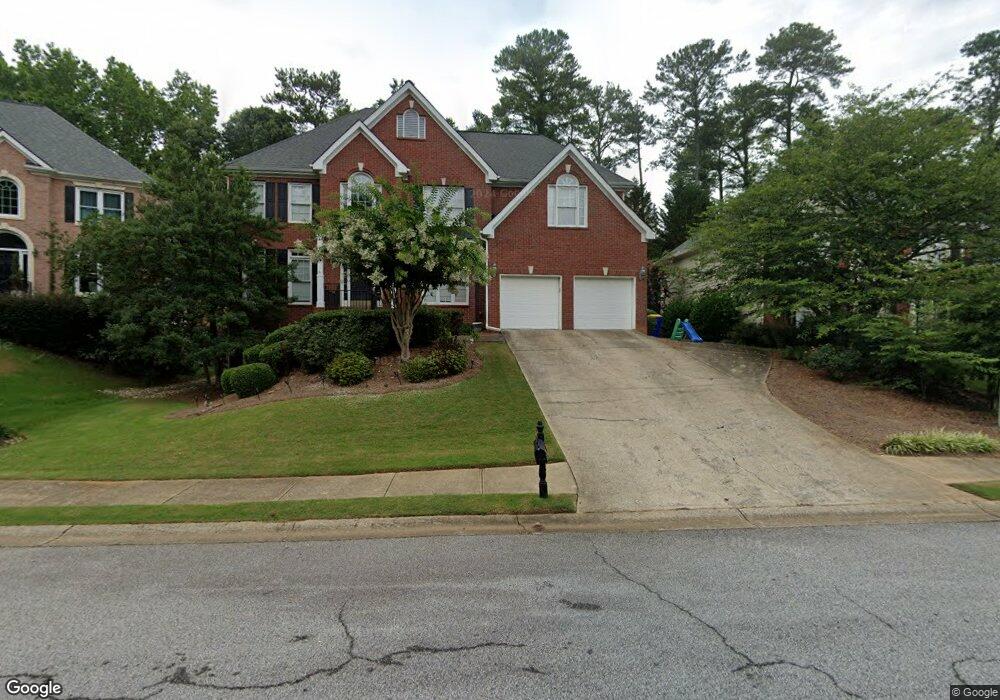
2947 Nestle Creek Dr Unit 24 Marietta, GA 30062
East Cobb NeighborhoodEstimated Value: $717,000 - $834,000
4
Beds
3
Baths
3,082
Sq Ft
$257/Sq Ft
Est. Value
About This Home
This home is located at 2947 Nestle Creek Dr Unit 24, Marietta, GA 30062 and is currently estimated at $793,115, approximately $257 per square foot. 2947 Nestle Creek Dr Unit 24 is a home located in Cobb County with nearby schools including Murdock Elementary School, Dodgen Middle School, and Pope High School.
Ownership History
Date
Name
Owned For
Owner Type
Purchase Details
Closed on
Oct 30, 2013
Sold by
Arvidson Maria Lea
Bought by
Dhanapalan Lavanya
Current Estimated Value
Home Financials for this Owner
Home Financials are based on the most recent Mortgage that was taken out on this home.
Original Mortgage
$297,750
Outstanding Balance
$221,368
Interest Rate
4.23%
Mortgage Type
New Conventional
Estimated Equity
$571,747
Purchase Details
Closed on
Jun 2, 2004
Sold by
Bourne Lawrence W and Bourne Joan P
Bought by
Arvidson Maria L and Arvidson Keith
Home Financials for this Owner
Home Financials are based on the most recent Mortgage that was taken out on this home.
Original Mortgage
$304,000
Interest Rate
4.88%
Mortgage Type
New Conventional
Purchase Details
Closed on
Mar 24, 1995
Sold by
Highland Homes Inc
Bought by
Bourne Lawrence W Joan P
Create a Home Valuation Report for This Property
The Home Valuation Report is an in-depth analysis detailing your home's value as well as a comparison with similar homes in the area
Home Values in the Area
Average Home Value in this Area
Purchase History
| Date | Buyer | Sale Price | Title Company |
|---|---|---|---|
| Dhanapalan Lavanya | $397,000 | -- | |
| Arvidson Maria L | $380,000 | -- | |
| Bourne Lawrence W Joan P | $264,100 | -- |
Source: Public Records
Mortgage History
| Date | Status | Borrower | Loan Amount |
|---|---|---|---|
| Open | Dhanapalan Lavanya | $297,750 | |
| Previous Owner | Arvidson Maria L | $304,000 | |
| Closed | Bourne Lawrence W Joan P | $0 |
Source: Public Records
Tax History Compared to Growth
Tax History
| Year | Tax Paid | Tax Assessment Tax Assessment Total Assessment is a certain percentage of the fair market value that is determined by local assessors to be the total taxable value of land and additions on the property. | Land | Improvement |
|---|---|---|---|---|
| 2025 | $7,618 | $317,752 | $60,000 | $257,752 |
| 2024 | $5,841 | $235,536 | $52,000 | $183,536 |
| 2023 | $5,298 | $235,536 | $52,000 | $183,536 |
| 2022 | $5,131 | $201,052 | $46,000 | $155,052 |
| 2021 | $5,131 | $201,052 | $46,000 | $155,052 |
| 2020 | $5,131 | $201,052 | $46,000 | $155,052 |
| 2019 | $5,131 | $201,052 | $46,000 | $155,052 |
| 2018 | $4,702 | $181,436 | $37,600 | $143,836 |
| 2017 | $4,535 | $181,436 | $37,600 | $143,836 |
| 2016 | $3,779 | $146,860 | $30,800 | $116,060 |
| 2015 | $3,865 | $146,860 | $30,800 | $116,060 |
| 2014 | $3,894 | $146,860 | $0 | $0 |
Source: Public Records
Map
Nearby Homes
- 2792 Craig Ct
- 1519 Brookcliff Cir
- 1771 Canton Hills Cir
- 2764 Brookcliff Landing
- 2988 Nestle Creek Dr
- 1686 N Cobb Pkwy
- 1677 Daffodil Dr
- 2726 Whitehurst Dr NE
- 2674 Skylane Dr
- 1670 Holly Springs Rd NE
- 1900 Holly Springs Rd NE
- 1246 Stonecroft Way
- 3025 Bunker Hill Cir
- 2994 Octavia Cir
- 1502 Wood Thrush Way
- 2868 Octavia Cir
- 2880 Octavia Cir
- 2947 Nestle Creek Dr
- 2949 Nestle Creek Dr
- 2945 Nestle Creek Dr
- 2936 Canton Chase Dr Unit 2
- 2951 Nestle Creek Dr
- 2938 Canton Chase Dr
- 2934 Canton Chase Dr
- 2948 Nestle Creek Dr
- 2950 Nestle Creek Dr
- 2953 Nestle Creek Dr
- 2943 Nestle Creek Dr
- 2946 Nestle Creek Dr
- 2940 Canton Chase Dr
- 0 Nestle Creek Dr Unit 8648102
- 0 Nestle Creek Dr Unit 8891678
- 0 Nestle Creek Dr Unit 7434698
- 0 Nestle Creek Dr Unit 7254245
- 0 Nestle Creek Dr Unit 7096092
- 0 Nestle Creek Dr Unit 3119991
- 0 Nestle Creek Dr Unit 3249943