2948 111th St Toledo, OH 43611
Point Place NeighborhoodEstimated Value: $135,000 - $149,000
3
Beds
2
Baths
1,308
Sq Ft
$108/Sq Ft
Est. Value
About This Home
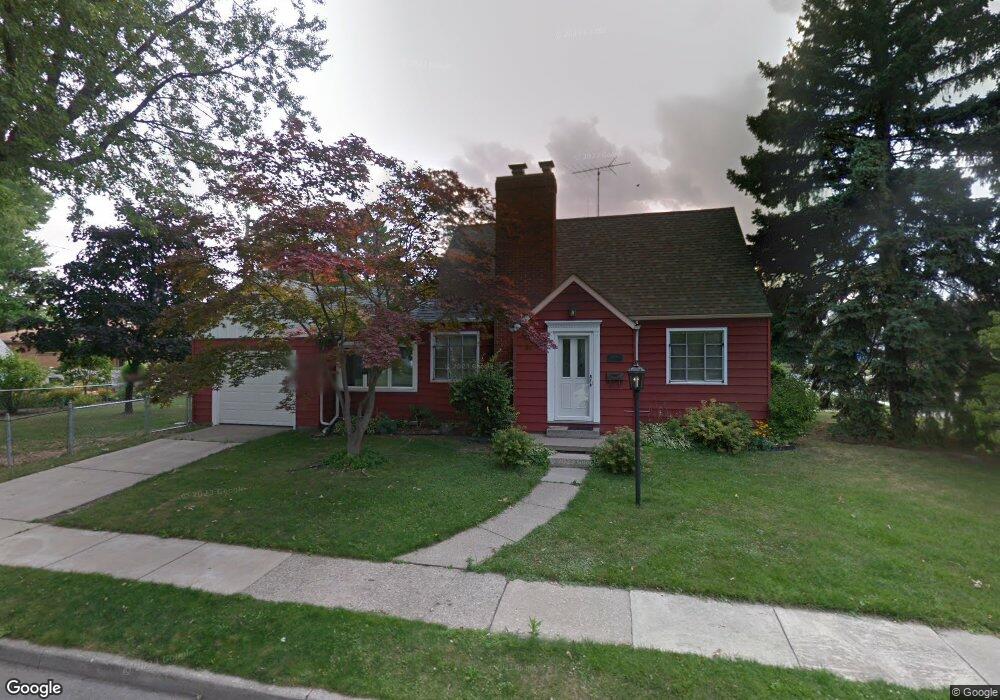
This home is located at 2948 111th St, Toledo, OH 43611 and is currently estimated at $141,330, approximately $108 per square foot. 2948 111th St is a home located in Lucas County with nearby schools including Ottawa River Elementary School, Woodward High School, and Imagine Environmental Science Academy.
Ownership History
Date
Name
Owned For
Owner Type
Purchase Details
Closed on
Jan 23, 2015
Sold by
Talip Maurice N and Talip Clara M
Bought by
Butler Sean P
Current Estimated Value
Home Financials for this Owner
Home Financials are based on the most recent Mortgage that was taken out on this home.
Original Mortgage
$53,011
Outstanding Balance
$41,426
Interest Rate
4.4%
Mortgage Type
FHA
Estimated Equity
$99,904
Purchase Details
Closed on
Jul 9, 2007
Sold by
Talip Clara M and Talip Maurice N
Bought by
Talip Clara M and Talip Maurice N
Purchase Details
Closed on
Aug 14, 1990
Sold by
Rahe D L and J L
Create a Home Valuation Report for This Property
The Home Valuation Report is an in-depth analysis detailing your home's value as well as a comparison with similar homes in the area
Home Values in the Area
Average Home Value in this Area
Purchase History
| Date | Buyer | Sale Price | Title Company |
|---|---|---|---|
| Butler Sean P | $54,000 | None Available | |
| Talip Clara M | -- | None Available | |
| -- | $58,500 | -- |
Source: Public Records
Mortgage History
| Date | Status | Borrower | Loan Amount |
|---|---|---|---|
| Open | Butler Sean P | $53,011 |
Source: Public Records
Tax History Compared to Growth
Tax History
| Year | Tax Paid | Tax Assessment Tax Assessment Total Assessment is a certain percentage of the fair market value that is determined by local assessors to be the total taxable value of land and additions on the property. | Land | Improvement |
|---|---|---|---|---|
| 2024 | $1,029 | $29,855 | $6,650 | $23,205 |
| 2023 | $1,798 | $24,430 | $6,370 | $18,060 |
| 2022 | $1,798 | $24,430 | $6,370 | $18,060 |
| 2021 | $1,823 | $24,430 | $6,370 | $18,060 |
| 2020 | $2,030 | $24,150 | $5,425 | $18,725 |
| 2019 | $1,883 | $24,150 | $5,425 | $18,725 |
| 2018 | $1,918 | $24,150 | $5,425 | $18,725 |
| 2017 | $1,931 | $23,590 | $5,285 | $18,305 |
| 2016 | $1,948 | $67,400 | $15,100 | $52,300 |
| 2015 | $1,936 | $67,400 | $15,100 | $52,300 |
| 2014 | $1,525 | $23,600 | $5,290 | $18,310 |
| 2013 | $1,525 | $23,600 | $5,290 | $18,310 |
Source: Public Records
Map
Nearby Homes