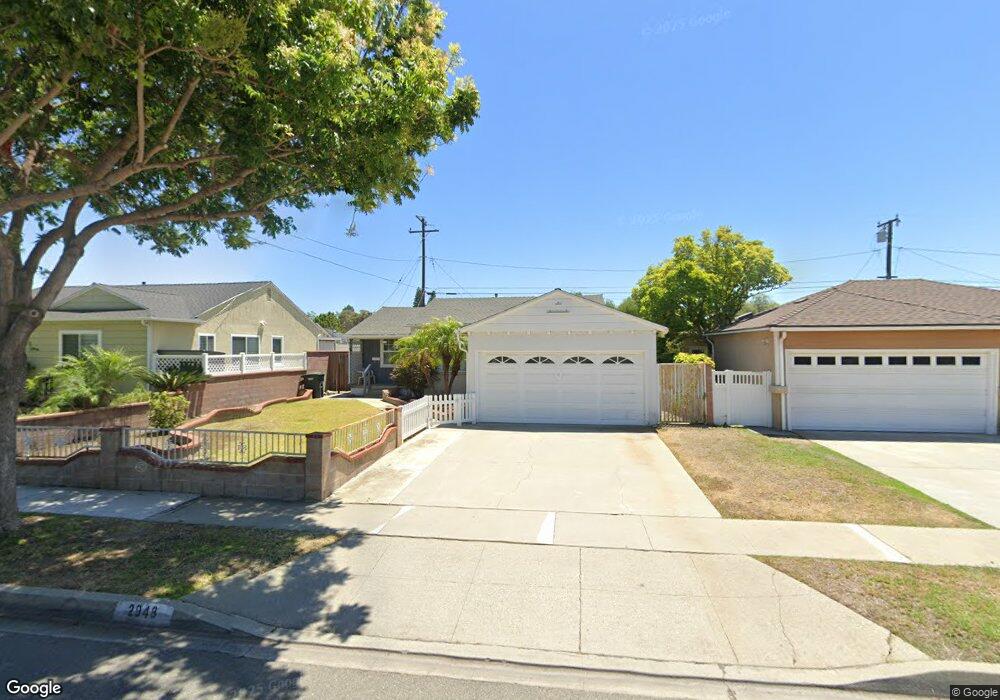
2948 Allred St Lakewood, CA 90712
Lakewood Mutual NeighborhoodEstimated Value: $777,321 - $811,000
2
Beds
1
Bath
966
Sq Ft
$820/Sq Ft
Est. Value
About This Home
This home is located at 2948 Allred St, Lakewood, CA 90712 and is currently estimated at $791,830, approximately $819 per square foot. 2948 Allred St is a home located in Los Angeles County with nearby schools including Riley Elementary School, Hoover Middle School, and Lakewood High School.
Ownership History
Date
Name
Owned For
Owner Type
Purchase Details
Closed on
Jul 11, 2002
Sold by
White Lillian M
Bought by
White Lillian M and Lillian M White 2002 Intervivos Trust
Current Estimated Value
Purchase Details
Closed on
Nov 28, 2001
Sold by
Halter Berthold F and Halter Donna L
Bought by
White Lillian M
Home Financials for this Owner
Home Financials are based on the most recent Mortgage that was taken out on this home.
Original Mortgage
$112,500
Interest Rate
6.2%
Mortgage Type
Stand Alone First
Purchase Details
Closed on
Mar 23, 1995
Sold by
Warner Nancy and Falk Bernice
Bought by
Halter Berthold F
Home Financials for this Owner
Home Financials are based on the most recent Mortgage that was taken out on this home.
Original Mortgage
$141,002
Interest Rate
8.86%
Mortgage Type
FHA
Create a Home Valuation Report for This Property
The Home Valuation Report is an in-depth analysis detailing your home's value as well as a comparison with similar homes in the area
Home Values in the Area
Average Home Value in this Area
Purchase History
| Date | Buyer | Sale Price | Title Company |
|---|---|---|---|
| White Lillian M | -- | -- | |
| White Lillian M | $225,000 | Lawyers Title Company | |
| Halter Berthold F | $144,000 | Continental Lawyers Title Co |
Source: Public Records
Mortgage History
| Date | Status | Borrower | Loan Amount |
|---|---|---|---|
| Previous Owner | White Lillian M | $112,500 | |
| Previous Owner | Halter Berthold F | $141,002 |
Source: Public Records
Tax History Compared to Growth
Tax History
| Year | Tax Paid | Tax Assessment Tax Assessment Total Assessment is a certain percentage of the fair market value that is determined by local assessors to be the total taxable value of land and additions on the property. | Land | Improvement |
|---|---|---|---|---|
| 2025 | $4,536 | $332,369 | $265,903 | $66,466 |
| 2024 | $4,536 | $325,853 | $260,690 | $65,163 |
| 2023 | $4,459 | $319,465 | $255,579 | $63,886 |
| 2022 | $4,195 | $313,202 | $250,568 | $62,634 |
| 2021 | $4,110 | $307,061 | $245,655 | $61,406 |
| 2019 | $4,048 | $297,956 | $238,370 | $59,586 |
| 2018 | $3,879 | $292,115 | $233,697 | $58,418 |
| 2016 | $3,573 | $280,773 | $224,623 | $56,150 |
| 2015 | $3,437 | $276,556 | $221,249 | $55,307 |
| 2014 | $3,415 | $271,140 | $216,916 | $54,224 |
Source: Public Records
Map
Nearby Homes
- 2922 Eckleson St
- 2918 Yearling St
- 2912 Yearling St
- 3244 Centralia St
- 4559 Levelside Ave
- 2739 Denmead St
- 2523 Allred St
- 2803 Frankel St
- 4944 Coke Ave
- 3638 Sandwood St
- 2729 Greentop St
- 4848 Oliva Ave
- 5450 N Paramount Blvd Unit 12
- 5602 Verdura Ave
- 4328 Deeboyar Ave
- 4740 Pepperwood Ave
- 5500 Ackerfield Ave Unit 104
- 4121 Country Club Dr
- 5530 Ackerfield Ave Unit 206
- 4532 Pepperwood Ave
- 2942 Allred St
- 2952 Allred St
- 2949 Deerford St
- 2938 Allred St
- 2953 Deerford St
- 2943 Deerford St
- 2937 Deerford St
- 2932 Allred St
- 2949 Allred St
- 2945 Allred St
- 2955 Allred St
- 2939 Allred St
- 2933 Deerford St
- 4812 Obispo Ave
- 4818 Obispo Ave
- 2926 Allred St
- 4808 Obispo Ave
- 4822 Obispo Ave
- 2935 Allred St
- 4802 Obispo Ave