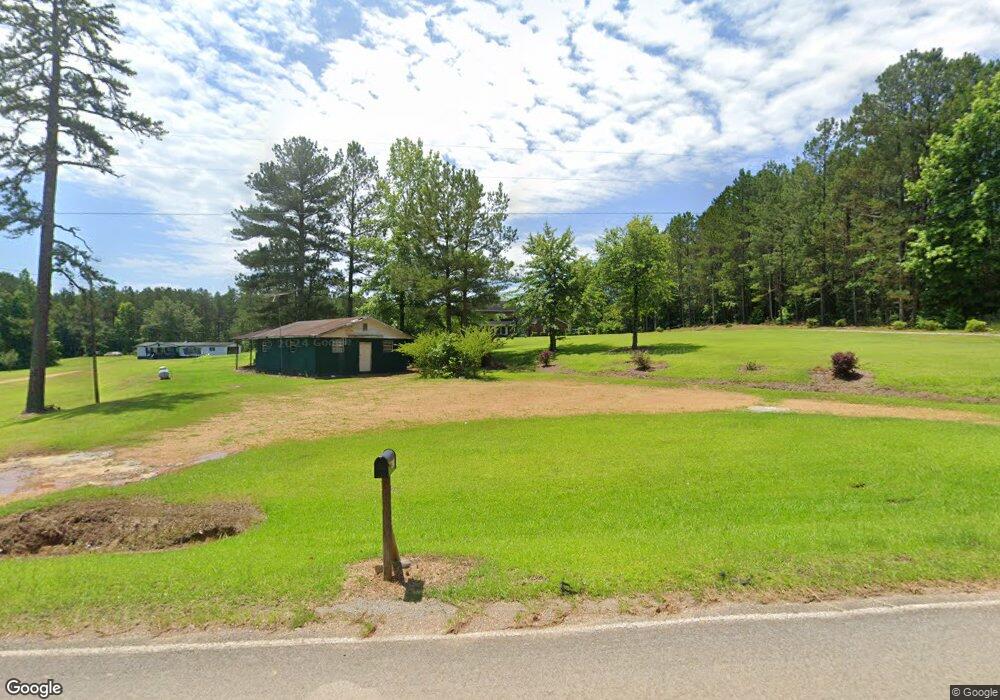
2948 Elijah Graham Rd Noxapater, MS 39346
Estimated Value: $193,000 - $260,000
3
Beds
--
Bath
2,410
Sq Ft
$91/Sq Ft
Est. Value
About This Home
This home is located at 2948 Elijah Graham Rd, Noxapater, MS 39346 and is currently estimated at $218,546, approximately $90 per square foot. 2948 Elijah Graham Rd is a home with nearby schools including Noxapater Attendance Center.
Create a Home Valuation Report for This Property
The Home Valuation Report is an in-depth analysis detailing your home's value as well as a comparison with similar homes in the area
Home Values in the Area
Average Home Value in this Area
Tax History Compared to Growth
Tax History
| Year | Tax Paid | Tax Assessment Tax Assessment Total Assessment is a certain percentage of the fair market value that is determined by local assessors to be the total taxable value of land and additions on the property. | Land | Improvement |
|---|---|---|---|---|
| 2024 | $1,008 | $12,322 | $900 | $11,422 |
| 2023 | $1,010 | $12,322 | $900 | $11,422 |
| 2022 | $1,026 | $12,445 | $900 | $11,545 |
| 2021 | $1,027 | $12,445 | $900 | $11,545 |
| 2020 | $933 | $11,557 | $900 | $10,657 |
| 2019 | $912 | $11,557 | $900 | $10,657 |
| 2018 | $861 | $11,557 | $900 | $10,657 |
| 2017 | $881 | $11,557 | $900 | $10,657 |
| 2016 | $760 | $10,469 | $675 | $9,794 |
| 2015 | $763 | $10,661 | $675 | $9,986 |
| 2014 | -- | $10,441 | $675 | $9,766 |
| 2012 | -- | $10,744 | $675 | $10,069 |
Source: Public Records
Map
Nearby Homes
- 0000 Elijah Graham Rd
- 0 Rd
- 744 Fred Holdiness Rd
- 0 Rd 832 Unit 25-257
- 496 Roberts Rd
- 0 Fred Holdiness Rd
- Hwy 395
- Hwy 15 S
- 0 Road 2808 Unit 25-763
- 10251 Mississippi 395
- 10701 County Road 573
- 4850 Mississippi 395
- 000 Mississippi 395
- 4744 Kilpatrick St
- 001 Mississippi 15
- 0 Mississippi 15
- 2315 Young Crossing Rd
- 0 Road 393 Unit 25-826
- 0 Road 393 Unit 25-825
- 1305 Johnson 5 Rd
- 3032 Elijah Graham Rd
- 12310 Elijah Graham Rd
- 3021 Elijah Graham Rd
- 2875 Elijah Graham Rd
- 2811 Elijah Graham Rd
- 1500 Elijah Graham Rd
- 0 Elijah Graham Rd
- 2701 Elijah Graham Rd
- 2387 Elijah Graham Rd
- 2564 Elijah Graham Rd
- 205 Wilson Triplett Rd
- 246 Bud Darby Rd
- 79 Wilson Hathorn Loop Rd
- 995 Mount Pleasant Rd
- 366 Bud Darby Rd
- 1033 Wilson Triplett Rd
- 386 Deer Camp Rd
- 3421 Mary Cole Rd
- 743 Wilson Triplett Rd
- 139 Ray McDonald Rd