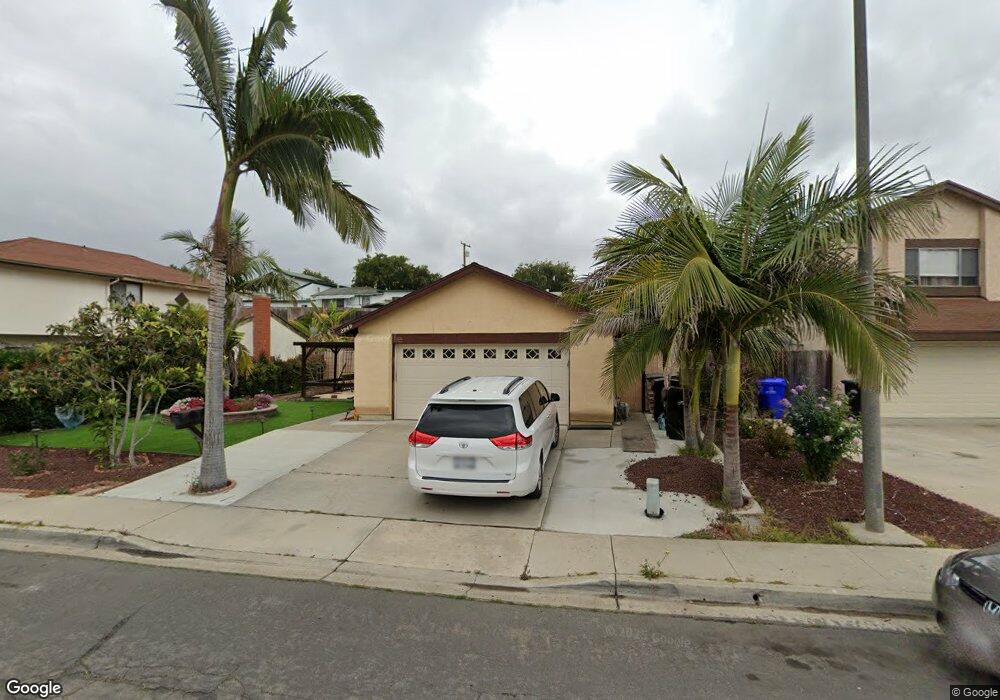
2949 Frankel Way San Diego, CA 92111
Linda Vista NeighborhoodEstimated Value: $933,586 - $1,045,000
3
Beds
2
Baths
1,159
Sq Ft
$832/Sq Ft
Est. Value
About This Home
This home is located at 2949 Frankel Way, San Diego, CA 92111 and is currently estimated at $963,897, approximately $831 per square foot. 2949 Frankel Way is a home located in San Diego County with nearby schools including Linda Vista Elementary School, Montgomery Middle School, and San Diego Cooperative Charter School.
Ownership History
Date
Name
Owned For
Owner Type
Purchase Details
Closed on
Sep 20, 2010
Sold by
Bien Thao Thi Phuong
Bought by
Chau Binh Dennis
Current Estimated Value
Home Financials for this Owner
Home Financials are based on the most recent Mortgage that was taken out on this home.
Original Mortgage
$120,000
Interest Rate
4.23%
Mortgage Type
New Conventional
Purchase Details
Closed on
Sep 13, 2010
Sold by
Chavez Arnulfo and Rojas Marina
Bought by
Chau Binh Dennis
Home Financials for this Owner
Home Financials are based on the most recent Mortgage that was taken out on this home.
Original Mortgage
$120,000
Interest Rate
4.23%
Mortgage Type
New Conventional
Purchase Details
Closed on
Mar 15, 2005
Sold by
Pytel Kenneth J
Bought by
Chavez Arnulfo and Rojas Marina
Home Financials for this Owner
Home Financials are based on the most recent Mortgage that was taken out on this home.
Original Mortgage
$400,000
Interest Rate
5.25%
Mortgage Type
Purchase Money Mortgage
Purchase Details
Closed on
Dec 10, 1985
Create a Home Valuation Report for This Property
The Home Valuation Report is an in-depth analysis detailing your home's value as well as a comparison with similar homes in the area
Home Values in the Area
Average Home Value in this Area
Purchase History
| Date | Buyer | Sale Price | Title Company |
|---|---|---|---|
| Chau Binh Dennis | -- | Chicago Title Co | |
| Chau Binh Dennis | $330,000 | Chicago Title Company | |
| Chavez Arnulfo | $500,000 | Southland Title | |
| -- | $103,500 | -- |
Source: Public Records
Mortgage History
| Date | Status | Borrower | Loan Amount |
|---|---|---|---|
| Previous Owner | Chau Binh Dennis | $120,000 | |
| Previous Owner | Chavez Arnulfo | $400,000 | |
| Closed | Chavez Arnulfo | $100,000 |
Source: Public Records
Tax History Compared to Growth
Tax History
| Year | Tax Paid | Tax Assessment Tax Assessment Total Assessment is a certain percentage of the fair market value that is determined by local assessors to be the total taxable value of land and additions on the property. | Land | Improvement |
|---|---|---|---|---|
| 2025 | $5,161 | $422,773 | $294,663 | $128,110 |
| 2024 | $5,161 | $414,485 | $288,886 | $125,599 |
| 2023 | $5,048 | $406,359 | $283,222 | $123,137 |
| 2022 | $4,913 | $398,392 | $277,669 | $120,723 |
| 2021 | $4,876 | $390,581 | $272,225 | $118,356 |
| 2020 | $4,813 | $386,577 | $269,434 | $117,143 |
| 2019 | $4,725 | $378,998 | $264,151 | $114,847 |
| 2018 | $4,420 | $371,568 | $258,972 | $112,596 |
| 2017 | $4,315 | $364,284 | $253,895 | $110,389 |
| 2016 | $4,242 | $357,142 | $248,917 | $108,225 |
| 2015 | $4,180 | $351,779 | $245,179 | $106,600 |
| 2014 | $4,116 | $344,889 | $240,377 | $104,512 |
Source: Public Records
Map
Nearby Homes
- 2868-70 Preece St
- 2818 Nye St
- 2750 Wheatstone St Unit 113
- 2750 Wheatstone St Unit 105
- 2750 Wheatstone St Unit 89
- 2750 Wheatstone St Unit 64
- 3161 Mount Tami Dr
- 2675 Comstock St
- 3262 Mount Carol Dr
- 6328-30 Quillan St
- 3014 Old Bridgeport Way
- 3173 Via Arcilla
- 3226 Old Heather Rd
- 3120 Old Bridgeport Way
- 2525 Inman Ct
- 3047 Old Bridgeport Way
- 6728 Thomson Ct
- 3270 W Fox Run Way Unit 2
- 6929 Park Mesa Way Unit 126
- 5360 Burford St
- 2959 Frankel Way
- 2939 Frankel Way
- 6542 Comly St
- 2969 Frankel Way
- 2929 Frankel Way
- 6536 Comly St
- 6548 Comly St
- 2919 Frankel Way
- 2960 Frankel Way
- 2979 Frankel Way
- 2970 Frankel Way
- 2950 Frankel Way
- 2940 Frankel Way
- 6505 High Knoll Rd
- 6556 Comly St
- 2930 Frankel Way
- 2980 Frankel Way
- 6480 Canyon Vista Ct
- 6545 Comly St
- 6515 High Knoll Rd