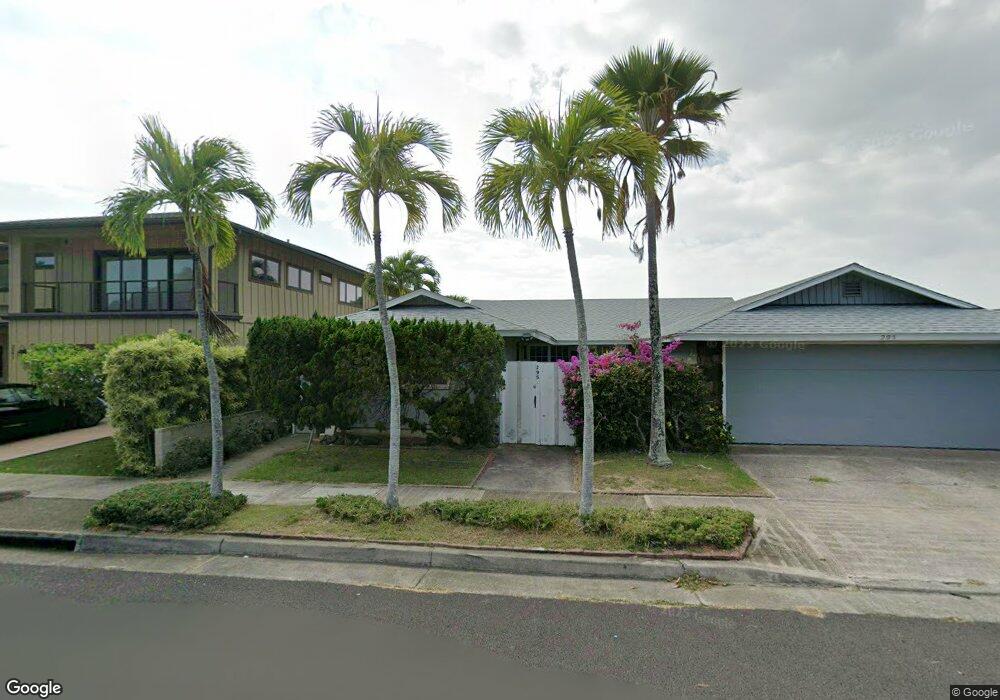
295 Ainahou St Honolulu, HI 96825
Hawaii Kai NeighborhoodEstimated Value: $1,745,473 - $2,044,000
4
Beds
3
Baths
2,168
Sq Ft
$851/Sq Ft
Est. Value
About This Home
This home is located at 295 Ainahou St, Honolulu, HI 96825 and is currently estimated at $1,845,868, approximately $851 per square foot. 295 Ainahou St is a home located in Honolulu County with nearby schools including Haha'ione Elementary School, Niu Valley Middle School, and Honolulu Waldorf School.
Ownership History
Date
Name
Owned For
Owner Type
Purchase Details
Closed on
Aug 5, 2024
Sold by
Jose Wong Quant Revocable Living Trust and Wong Hope Esperanza
Bought by
Jose Wong Quant Revocable Living Trust and Wong
Current Estimated Value
Purchase Details
Closed on
Aug 6, 2007
Sold by
Quant Jose Wong and De Wong Hope Esperanza Lai
Bought by
Quant Jose Wong and Jose Wong Quant Revocable Living Trust
Purchase Details
Closed on
Sep 21, 2001
Sold by
Sweeney Michael Baird and Sweeney Sonya May
Bought by
Lai Ana Regina Wong
Home Financials for this Owner
Home Financials are based on the most recent Mortgage that was taken out on this home.
Original Mortgage
$288,000
Interest Rate
6.91%
Purchase Details
Closed on
Feb 6, 2001
Sold by
Lim Chhorn Ear and Lim Brenda Gonzales
Bought by
Quant Jose Wong and Dewong Hope Esperanza Lai
Purchase Details
Closed on
Aug 26, 1999
Sold by
Koyanagi Kenneth K
Bought by
Quant Jose Wong and Wong Esperanza Lai De
Create a Home Valuation Report for This Property
The Home Valuation Report is an in-depth analysis detailing your home's value as well as a comparison with similar homes in the area
Home Values in the Area
Average Home Value in this Area
Purchase History
| Date | Buyer | Sale Price | Title Company |
|---|---|---|---|
| Jose Wong Quant Revocable Living Trust | -- | None Listed On Document | |
| Quant Jose Wong | -- | None Available | |
| Lai Ana Regina Wong | $308,000 | -- | |
| Quant Jose Wong | $335,000 | -- | |
| Quant Jose Wong | $316,000 | -- |
Source: Public Records
Mortgage History
| Date | Status | Borrower | Loan Amount |
|---|---|---|---|
| Previous Owner | Lai Ana Regina Wong | $288,000 |
Source: Public Records
Tax History Compared to Growth
Tax History
| Year | Tax Paid | Tax Assessment Tax Assessment Total Assessment is a certain percentage of the fair market value that is determined by local assessors to be the total taxable value of land and additions on the property. | Land | Improvement |
|---|---|---|---|---|
| 2025 | $4,587 | $1,606,000 | $1,375,100 | $230,900 |
| 2024 | $4,587 | $1,470,600 | $1,210,100 | $260,500 |
| 2023 | $9,865 | $1,514,500 | $1,127,600 | $386,900 |
| 2022 | $7,086 | $1,246,300 | $1,045,100 | $201,200 |
| 2021 | $7,130 | $1,250,500 | $924,100 | $326,400 |
| 2020 | $6,619 | $1,201,800 | $946,100 | $255,700 |
| 2019 | $3,826 | $1,213,200 | $935,100 | $278,100 |
| 2018 | $3,561 | $1,137,500 | $902,100 | $235,400 |
| 2017 | $3,484 | $1,115,300 | $858,100 | $257,200 |
| 2016 | $3,538 | $1,130,900 | $808,600 | $322,300 |
| 2015 | $3,171 | $1,026,000 | $737,100 | $288,900 |
| 2014 | $2,134 | $929,900 | $643,600 | $286,300 |
Source: Public Records
Map
Nearby Homes
- 356 Opihikao Place Unit 542
- 1 Keahole Place Unit 2607
- 1 Keahole Place Unit 2511
- 1 Keahole Place Unit 3512
- 1 Keahole Place Unit 2602
- 1 Keahole Place Unit 3310
- 6311 Paauilo Place
- 7000 Hawaii Kai Dr Unit P98
- 7000 Hawaii Kai Dr Unit 2702
- 7000 Hawaii Kai Dr Unit 2610
- 7000 Hawaii Kai Dr Unit S1002
- 7000 Hawaii Kai Dr Unit 3115
- 7000 Hawaii Kai Dr Unit P248
- 7000 Hawaii Kai Dr Unit 2111
- 6307 Kaiwiki Place
- 6770 Hawaii Kai Dr Unit 402
- 6770 Hawaii Kai Dr Unit 24
- 6770 Hawaii Kai Dr Unit 409
- 7012 Hawaii Kai Dr Unit 207
- 7012 Hawaii Kai Dr Unit 205
- 301 Ainahou St
- 291 Ainahou St
- 305 Ainahou St
- 287 Ainahou St
- 296 Ainahou St
- 292 Ainahou St
- 302 Ainahou St
- 283 Ainahou St
- 286 Ainahou St
- 310 Ainahou St
- 311 Ainahou St
- 303 Kukuau Place
- 305 Kukuau Place
- 279 Ainahou St
- 278 Ainahou St
- 320 Ainahou St
- 309 Kukuau Place
- 301 Kukuau Place
- 275 Ainahou St
- 328 Ainahou St