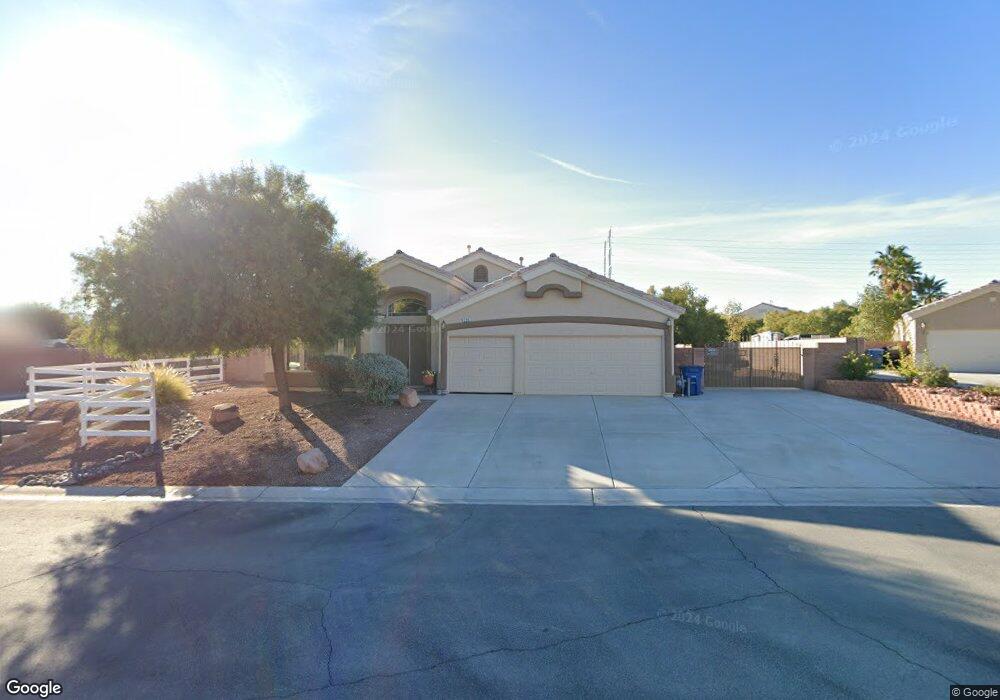
295 Bruce Dern Ave Las Vegas, NV 89183
Silverado Ranch NeighborhoodEstimated Value: $573,000 - $665,000
4
Beds
3
Baths
2,299
Sq Ft
$264/Sq Ft
Est. Value
About This Home
This home is located at 295 Bruce Dern Ave, Las Vegas, NV 89183 and is currently estimated at $607,344, approximately $264 per square foot. 295 Bruce Dern Ave is a home located in Clark County with nearby schools including John C. Bass Elementary School, Charles Silvestri Junior High School, and Liberty High School.
Ownership History
Date
Name
Owned For
Owner Type
Purchase Details
Closed on
May 26, 2022
Sold by
Moss Family Joint Living Trust
Bought by
Gerald L Moss Living Trust
Current Estimated Value
Purchase Details
Closed on
Aug 8, 2017
Sold by
Moss Gerald L
Bought by
Moss Gerald L and Moss Susan K
Purchase Details
Closed on
Jul 12, 2004
Sold by
Moss Gerald L and Moss Susan K
Bought by
Moss Gerald L and Moss Susan K
Create a Home Valuation Report for This Property
The Home Valuation Report is an in-depth analysis detailing your home's value as well as a comparison with similar homes in the area
Home Values in the Area
Average Home Value in this Area
Purchase History
| Date | Buyer | Sale Price | Title Company |
|---|---|---|---|
| Gerald L Moss Living Trust | -- | None Listed On Document | |
| Moss Gerald L | -- | None Available | |
| Moss Gerald L | -- | -- |
Source: Public Records
Tax History Compared to Growth
Tax History
| Year | Tax Paid | Tax Assessment Tax Assessment Total Assessment is a certain percentage of the fair market value that is determined by local assessors to be the total taxable value of land and additions on the property. | Land | Improvement |
|---|---|---|---|---|
| 2025 | $2,847 | $149,964 | $56,000 | $93,964 |
| 2024 | $2,637 | $149,964 | $56,000 | $93,964 |
| 2023 | $2,637 | $148,374 | $59,150 | $89,224 |
| 2022 | $2,560 | $128,938 | $47,250 | $81,688 |
| 2021 | $2,486 | $124,962 | $47,250 | $77,712 |
| 2020 | $2,410 | $125,621 | $48,650 | $76,971 |
| 2019 | $2,340 | $114,359 | $38,500 | $75,859 |
| 2018 | $2,272 | $103,699 | $30,450 | $73,249 |
| 2017 | $3,075 | $104,848 | $30,450 | $74,398 |
| 2016 | $2,152 | $96,695 | $24,500 | $72,195 |
| 2015 | $2,147 | $78,421 | $18,200 | $60,221 |
| 2014 | $2,084 | $81,187 | $10,500 | $70,687 |
Source: Public Records
Map
Nearby Homes
- 10290 Marion Morrison Ct
- 357 Whispering Tree Ave
- 365 Sapphire Rock Ave
- 10058 Saint Augustine St
- 10410 La Cienega St
- 305 Spry Ave
- 187 Jalyn Rae Ct
- 338 Azar Swan Ave
- 10391 Celestial Echo St
- 10234 Renae Nicole Ct
- 0 La Cienega St
- 10151 Tumbling Tree St
- 328 Hedgehope Dr
- Sarah Plan at Pewter Valley Estates
- Rushmore Plan at Pewter Valley Estates
- Arlington Plan at Pewter Valley Estates
- 286 Bowsprit Ct
- 10164 Tree Bark St
- 508 Candy Mint Ave
- 10168 Cadmium St
- 10257 Placid St
- 287 Bruce Dern Ave
- 309 Bruce Dern Ave Unit 2
- 294 Bruce Dern Ave
- 278 Bruce Dern Ave
- 10273 Placid St
- 10256 Placid St
- 10270 Marion Morrison Ct
- 286 Bruce Dern Ave
- 308 Bruce Dern Ave
- 315 Bruce Dern Ave
- 10289 Placid St
- 10272 Placid St
- 293 Ben Johnson Ct
- 285 Ben Johnson Ct
- 10275 Marion Morrison Ct
- 10288 Placid St
- 314 Bruce Dern Ave
- 277 Ben Johnson Ct
- 322 Bruce Dern Ave