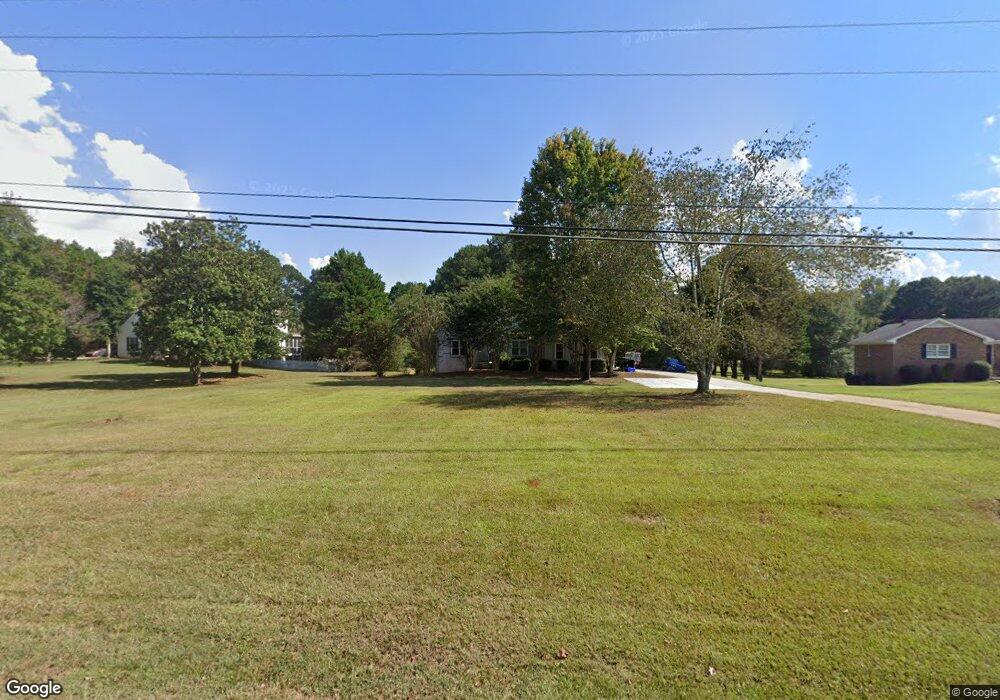
295 Castlewood Rd Tyrone, GA 30290
Estimated Value: $455,000 - $524,000
4
Beds
3
Baths
2,341
Sq Ft
$207/Sq Ft
Est. Value
About This Home
This home is located at 295 Castlewood Rd, Tyrone, GA 30290 and is currently estimated at $484,187, approximately $206 per square foot. 295 Castlewood Rd is a home located in Fayette County with nearby schools including Crabapple Lane Elementary School, Flat Rock Middle School, and Sandy Creek High School.
Ownership History
Date
Name
Owned For
Owner Type
Purchase Details
Closed on
Nov 3, 2020
Sold by
Schoon Mary Louise
Bought by
Thrasher Kalon
Current Estimated Value
Home Financials for this Owner
Home Financials are based on the most recent Mortgage that was taken out on this home.
Original Mortgage
$238,400
Outstanding Balance
$210,917
Interest Rate
2.8%
Mortgage Type
New Conventional
Estimated Equity
$273,270
Purchase Details
Closed on
Jan 9, 1998
Sold by
Woods Building & Develop Co Inc
Bought by
Schoon David S and Louise Schoon M
Home Financials for this Owner
Home Financials are based on the most recent Mortgage that was taken out on this home.
Original Mortgage
$155,000
Interest Rate
7.18%
Mortgage Type
New Conventional
Purchase Details
Closed on
Mar 18, 1996
Sold by
Woods William
Bought by
Woods Bldg Deve
Create a Home Valuation Report for This Property
The Home Valuation Report is an in-depth analysis detailing your home's value as well as a comparison with similar homes in the area
Home Values in the Area
Average Home Value in this Area
Purchase History
| Date | Buyer | Sale Price | Title Company |
|---|---|---|---|
| Thrasher Kalon | $298,000 | -- | |
| Schoon David S | $165,000 | -- | |
| Woods Bldg Deve | $1,000 | -- |
Source: Public Records
Mortgage History
| Date | Status | Borrower | Loan Amount |
|---|---|---|---|
| Open | Thrasher Kalon | $238,400 | |
| Previous Owner | Schoon David S | $155,000 | |
| Closed | Woods Bldg Deve | $0 |
Source: Public Records
Tax History Compared to Growth
Tax History
| Year | Tax Paid | Tax Assessment Tax Assessment Total Assessment is a certain percentage of the fair market value that is determined by local assessors to be the total taxable value of land and additions on the property. | Land | Improvement |
|---|---|---|---|---|
| 2024 | $4,131 | $173,444 | $24,000 | $149,444 |
| 2023 | $3,650 | $166,200 | $24,000 | $142,200 |
| 2022 | $3,967 | $158,880 | $24,000 | $134,880 |
| 2021 | $3,489 | $119,200 | $23,280 | $95,920 |
| 2020 | $3,512 | $116,200 | $24,000 | $92,200 |
| 2019 | $3,422 | $111,000 | $24,000 | $87,000 |
| 2018 | $3,458 | $111,000 | $19,000 | $92,000 |
| 2017 | $3,315 | $106,160 | $19,000 | $87,160 |
| 2016 | $3,039 | $95,640 | $19,000 | $76,640 |
| 2015 | $3,339 | $103,120 | $19,000 | $84,120 |
| 2014 | $2,950 | $89,920 | $19,000 | $70,920 |
| 2013 | -- | $88,720 | $0 | $0 |
Source: Public Records
Map
Nearby Homes
- 100 Clydesdale Ct
- 2185 Castle Lake Dr
- 200 Chaparral Trace
- 150 Kylemore Pass
- 135 Crimson Ridge
- 110 Kylemore Pass
- 475 Castlewood Rd
- 240 Lynnwood Ave
- 104 Ashland Trail
- 575 Laurelwood Dr
- 100 Ashland Trail
- 110 Calypso Ct
- 130 E Crestwood Rd
- 125 Meadowview Cir
- 110 Valley View Ct
- 0 Erwin Run Unit 10585589
- 121 Northwoods Rd
- 131 Lincoln Rd
- 11 Line Creek Cir
- 230 Hedgewick Way
- 285 Castlewood Rd
- 305 Castlewood Rd
- 315 Castlewood Rd
- 275 Castlewood Rd
- 2000 Castle Lake Dr
- 325 Castlewood Rd
- 2060 Castle Lake Dr
- 2050 Castle Lake Dr
- 2040 Castle Lake Dr Unit 14
- 2040 Castle Lake Dr
- 105 Arabian
- 2030 Castle Lake Dr
- 115 Arabian
- 2020 Castle Lake Dr Unit 12
- 2020 Castle Lake Dr
- N Castlewood Rd Unit 111
- Castlewood Rd Castlewood Rd
- 2010 Castle Lake Dr
- 2070 Castle Lake Dr
- 125 Arabian