Estimated Value: $509,000 - $571,251
3
Beds
1
Bath
930
Sq Ft
$586/Sq Ft
Est. Value
About This Home
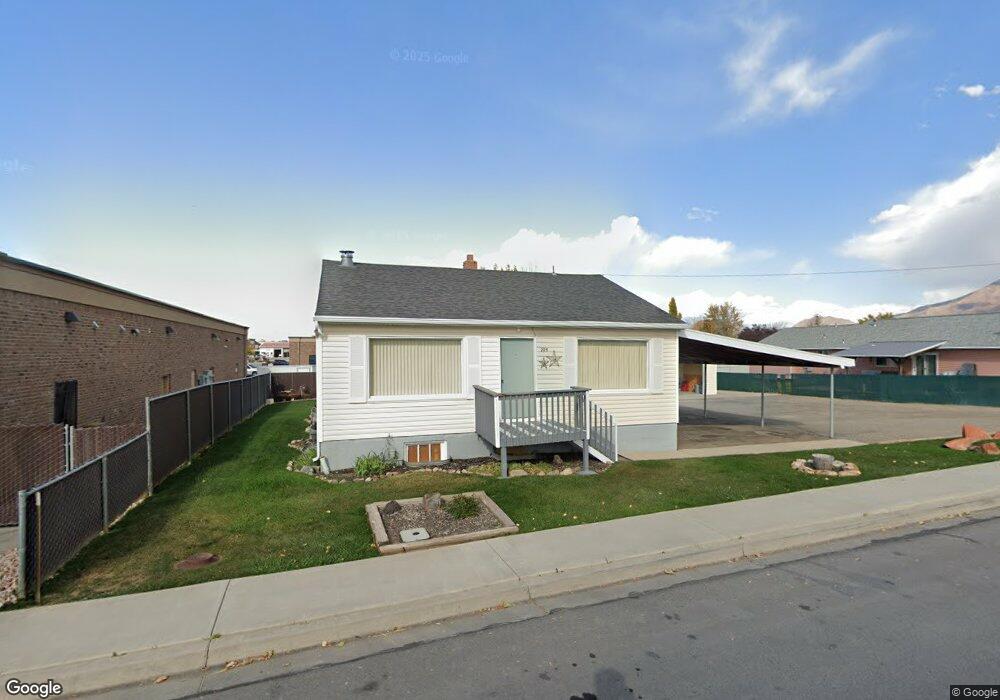
This home is located at 295 E 400 N, Salem, UT 84653 and is currently estimated at $544,750, approximately $585 per square foot. 295 E 400 N is a home with nearby schools including Salem Elementary, Salem Junior High School, and Valley View Middle School.
Ownership History
Date
Name
Owned For
Owner Type
Purchase Details
Closed on
Sep 19, 2016
Sold by
Nixon Eldon R and Nixon Debbie A
Bought by
Best Darlene
Current Estimated Value
Home Financials for this Owner
Home Financials are based on the most recent Mortgage that was taken out on this home.
Original Mortgage
$120,772
Outstanding Balance
$95,906
Interest Rate
3.25%
Mortgage Type
FHA
Estimated Equity
$448,844
Purchase Details
Closed on
Mar 18, 2005
Sold by
Farnsworth Bruce A and Farnsworth Merline
Bought by
Nixon Brothers Construction Inc
Create a Home Valuation Report for This Property
The Home Valuation Report is an in-depth analysis detailing your home's value as well as a comparison with similar homes in the area
Home Values in the Area
Average Home Value in this Area
Purchase History
| Date | Buyer | Sale Price | Title Company |
|---|---|---|---|
| Best Darlene | -- | Metro National Title | |
| Nixon Brothers Construction Inc | -- | -- |
Source: Public Records
Mortgage History
| Date | Status | Borrower | Loan Amount |
|---|---|---|---|
| Open | Best Darlene | $120,772 |
Source: Public Records
Tax History
| Year | Tax Paid | Tax Assessment Tax Assessment Total Assessment is a certain percentage of the fair market value that is determined by local assessors to be the total taxable value of land and additions on the property. | Land | Improvement |
|---|---|---|---|---|
| 2025 | $1,745 | $195,525 | -- | -- |
| 2024 | $1,745 | $176,990 | $0 | $0 |
| 2023 | $1,689 | $171,600 | $0 | $0 |
| 2022 | $1,796 | $179,630 | $0 | $0 |
| 2021 | $1,434 | $230,100 | $91,500 | $138,600 |
| 2020 | $1,370 | $214,000 | $83,200 | $130,800 |
| 2019 | $1,212 | $193,300 | $79,600 | $113,700 |
| 2018 | $1,124 | $171,300 | $72,400 | $98,900 |
| 2017 | $1,013 | $82,335 | $0 | $0 |
| 2016 | -- | $72,985 | $0 | $0 |
| 2015 | $831 | $65,615 | $0 | $0 |
| 2014 | $827 | $65,340 | $0 | $0 |
Source: Public Records
Map
Nearby Homes
- 1223 N 360 E Unit 129
- 1212 N 360 E Unit 132
- 1195 N 360 E Unit 127
- 1241 N 360 E Unit 130
- 1238 N 360 E Unit 133
- 1207 N 360 E Unit 128
- 1165 N 360 E Unit 75
- 432 E 300 N Unit 12
- 453 N 460 E
- 443 N 500 E Unit LOT 2
- 453 N 500 E Unit LOT 3
- 475 E 500 N Unit LOT 22
- 465 N 500 E Unit LOT 4
- 315 N 500 E
- 481 N 500 E Unit LOT 5
- 644 N 500 E Unit 111
- 513 E 400 North St
- 846 E 400 St N
- 625 N 220 E
- 253 N 100 E
Your Personal Tour Guide
Ask me questions while you tour the home.