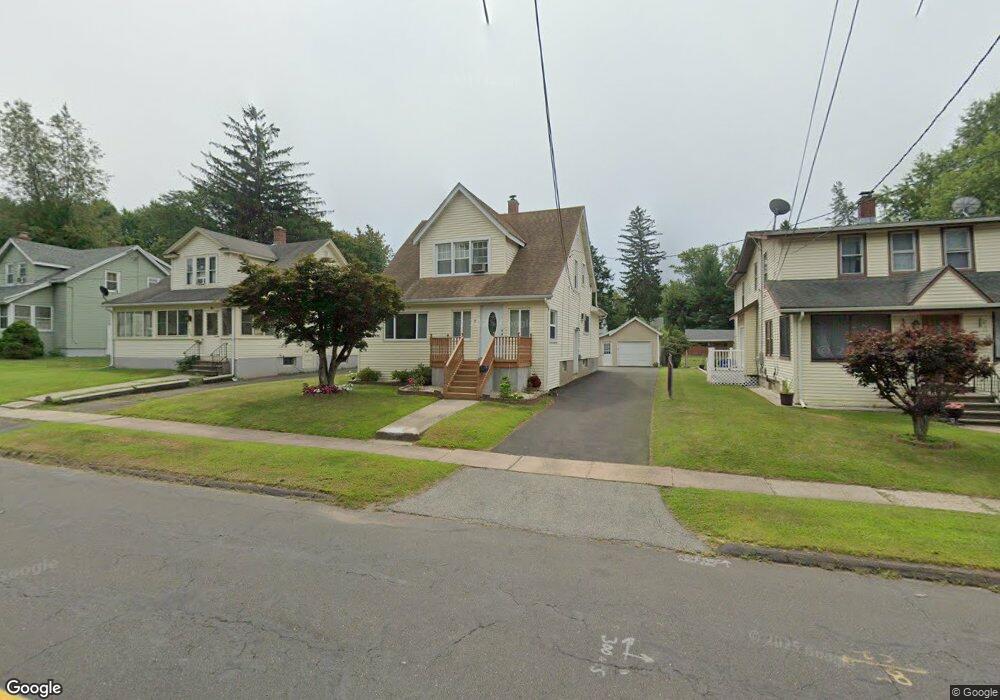
295 Nott St Wethersfield, CT 06109
Estimated Value: $316,000 - $347,456
3
Beds
2
Baths
1,231
Sq Ft
$268/Sq Ft
Est. Value
About This Home
This home is located at 295 Nott St, Wethersfield, CT 06109 and is currently estimated at $329,364, approximately $267 per square foot. 295 Nott St is a home located in Hartford County with nearby schools including Charles Wright School, Silas Deane Middle School, and Wethersfield High School.
Ownership History
Date
Name
Owned For
Owner Type
Purchase Details
Closed on
Jul 27, 2005
Sold by
Callaghan Patrick
Bought by
Esmic Semso and Esmic Zekija
Current Estimated Value
Home Financials for this Owner
Home Financials are based on the most recent Mortgage that was taken out on this home.
Original Mortgage
$169,100
Outstanding Balance
$88,888
Interest Rate
5.67%
Estimated Equity
$240,476
Purchase Details
Closed on
Dec 20, 2000
Sold by
Est Dawidowicz G and Dawidowicz Thomas
Bought by
Callaghan Patrick
Home Financials for this Owner
Home Financials are based on the most recent Mortgage that was taken out on this home.
Original Mortgage
$125,000
Interest Rate
9.85%
Create a Home Valuation Report for This Property
The Home Valuation Report is an in-depth analysis detailing your home's value as well as a comparison with similar homes in the area
Home Values in the Area
Average Home Value in this Area
Purchase History
| Date | Buyer | Sale Price | Title Company |
|---|---|---|---|
| Esmic Semso | $178,000 | -- | |
| Callaghan Patrick | $125,000 | -- |
Source: Public Records
Mortgage History
| Date | Status | Borrower | Loan Amount |
|---|---|---|---|
| Open | Callaghan Patrick | $169,100 | |
| Previous Owner | Callaghan Patrick | $143,000 | |
| Previous Owner | Callaghan Patrick | $125,000 |
Source: Public Records
Tax History
| Year | Tax Paid | Tax Assessment Tax Assessment Total Assessment is a certain percentage of the fair market value that is determined by local assessors to be the total taxable value of land and additions on the property. | Land | Improvement |
|---|---|---|---|---|
| 2025 | $6,966 | $168,990 | $73,540 | $95,450 |
| 2024 | $5,646 | $130,630 | $62,210 | $68,420 |
| 2023 | $5,458 | $130,630 | $62,210 | $68,420 |
| 2022 | $5,366 | $130,630 | $62,210 | $68,420 |
| 2021 | $5,313 | $130,630 | $62,210 | $68,420 |
| 2020 | $5,315 | $130,630 | $62,210 | $68,420 |
| 2019 | $5,322 | $130,630 | $62,210 | $68,420 |
| 2018 | $5,852 | $143,500 | $61,700 | $81,800 |
| 2017 | $5,707 | $143,500 | $61,700 | $81,800 |
| 2016 | $5,530 | $143,500 | $61,700 | $81,800 |
| 2015 | $5,480 | $143,500 | $61,700 | $81,800 |
| 2014 | $5,272 | $143,500 | $61,700 | $81,800 |
Source: Public Records
Map
Nearby Homes
- 192 Wolcott Hill Rd
- 23 Hillcrest Ave
- 55 Rutledge Rd
- 219-221 Jordan Ln
- 18 Avalon Place
- 1 Fernwood St
- 317-319 Garden St
- 107 Harmund Place
- 144 Brown St
- 1 Brussels Ave
- 1 Bristol St
- 19 Albert Ave
- 35 Stillwold Dr
- 295 Ridge Rd Unit 8
- 108 Chamberlain Rd
- 158 Dix Rd
- 28 Bolton St
- 493 Main St
- 131 Coleman Rd
- 764 Ridge Rd
Your Personal Tour Guide
Ask me questions while you tour the home.