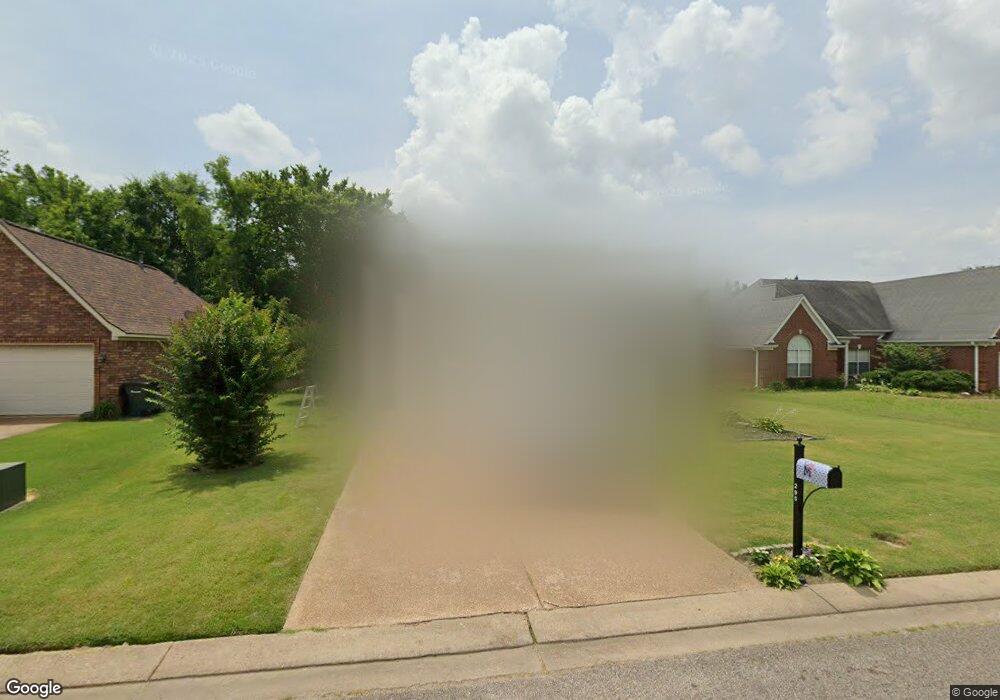
295 Susanne Dr Oakland, TN 38060
Estimated Value: $261,000 - $275,485
--
Bed
3
Baths
1,436
Sq Ft
$187/Sq Ft
Est. Value
About This Home
This home is located at 295 Susanne Dr, Oakland, TN 38060 and is currently estimated at $268,371, approximately $186 per square foot. 295 Susanne Dr is a home located in Fayette County with nearby schools including Oakland Elementary School, West Junior High School, and Fayette Ware Comprehensive High School.
Ownership History
Date
Name
Owned For
Owner Type
Purchase Details
Closed on
Dec 31, 2020
Sold by
Nichols Alicia L
Bought by
Kivelle Chelsea
Current Estimated Value
Home Financials for this Owner
Home Financials are based on the most recent Mortgage that was taken out on this home.
Original Mortgage
$175,500
Outstanding Balance
$156,607
Interest Rate
2.7%
Mortgage Type
New Conventional
Estimated Equity
$111,764
Purchase Details
Closed on
Aug 6, 2018
Sold by
Bartnick Marie S
Bought by
Nichols Alicia L
Home Financials for this Owner
Home Financials are based on the most recent Mortgage that was taken out on this home.
Original Mortgage
$153,000
Interest Rate
4.5%
Mortgage Type
USDA
Purchase Details
Closed on
Aug 10, 2005
Sold by
Charles Yoon Construction
Bought by
Bartnick Marie S
Purchase Details
Closed on
May 6, 2005
Bought by
Charles Yoon Construction Co
Purchase Details
Closed on
Oct 1, 2004
Bought by
Hill Christy Dba Ultra Homes
Create a Home Valuation Report for This Property
The Home Valuation Report is an in-depth analysis detailing your home's value as well as a comparison with similar homes in the area
Home Values in the Area
Average Home Value in this Area
Purchase History
| Date | Buyer | Sale Price | Title Company |
|---|---|---|---|
| Kivelle Chelsea | $195,000 | River Bluff Title Llc | |
| Nichols Alicia L | $153,000 | River Bluff Title Llc | |
| Bartnick Marie S | $133,900 | -- | |
| Charles Yoon Construction Co | $162,500 | -- | |
| Hill Christy Dba Ultra Homes | $290,000 | -- |
Source: Public Records
Mortgage History
| Date | Status | Borrower | Loan Amount |
|---|---|---|---|
| Open | Kivelle Chelsea | $175,500 | |
| Previous Owner | Nichols Alicia L | $153,000 |
Source: Public Records
Tax History Compared to Growth
Tax History
| Year | Tax Paid | Tax Assessment Tax Assessment Total Assessment is a certain percentage of the fair market value that is determined by local assessors to be the total taxable value of land and additions on the property. | Land | Improvement |
|---|---|---|---|---|
| 2024 | $602 | $47,450 | $9,500 | $37,950 |
| 2023 | $1,226 | $47,450 | $0 | $0 |
| 2022 | $813 | $47,450 | $9,500 | $37,950 |
| 2021 | $813 | $47,450 | $9,500 | $37,950 |
| 2020 | $542 | $47,450 | $9,500 | $37,950 |
| 2019 | $730 | $35,950 | $7,500 | $28,450 |
| 2018 | $751 | $35,950 | $7,500 | $28,450 |
| 2017 | $640 | $35,950 | $7,500 | $28,450 |
| 2016 | $638 | $33,500 | $7,500 | $26,000 |
| 2015 | $637 | $33,500 | $7,500 | $26,000 |
| 2014 | $637 | $33,500 | $7,500 | $26,000 |
Source: Public Records
Map
Nearby Homes
- 245 Mossy Springs Dr
- 245 Susanne Dr
- 30 Mossy Springs Cove
- 45 Sadie Cove
- 165 Susanne Dr
- 40 Windy Cove
- 70 Valleyview Ln
- 170 Oakland Ridge Cove
- 25 Breezy Loop
- 0 Mcfadden Dr Unit 10209515
- 65 Grace Ann Ln
- 280 Beau Tisdale Dr
- 215 Hughetta St S
- 30 Southampton St
- 265 Kipling Dr
- 250 Kipling Dr
- 270 Oak St
- 24.17 AC Tennessee 194
- 40 Gracie Cove
- 45 Bob White Rd
- 305 Susanne Dr
- 285 Susanne Dr
- 275 Susanne Dr
- 315 Susanne Dr
- 300 Susanne Dr
- 280 Susanne Dr
- 270 Susanne Dr
- 300 Green Valley Dr
- 325 Susanne Dr
- 260 Susanne Dr
- 330 Susanne Dr
- 215 Mossy Springs Dr
- 315 Green Valley Dr
- 280 Green Valley Dr
- 205 Mossy Springs Dr
- 265 Mossy Springs Dr
- 270 Green Valley Dr
- 195 Mossy Springs Dr
- 285 Green Valley Dr
- 230 Mossy Springs Dr