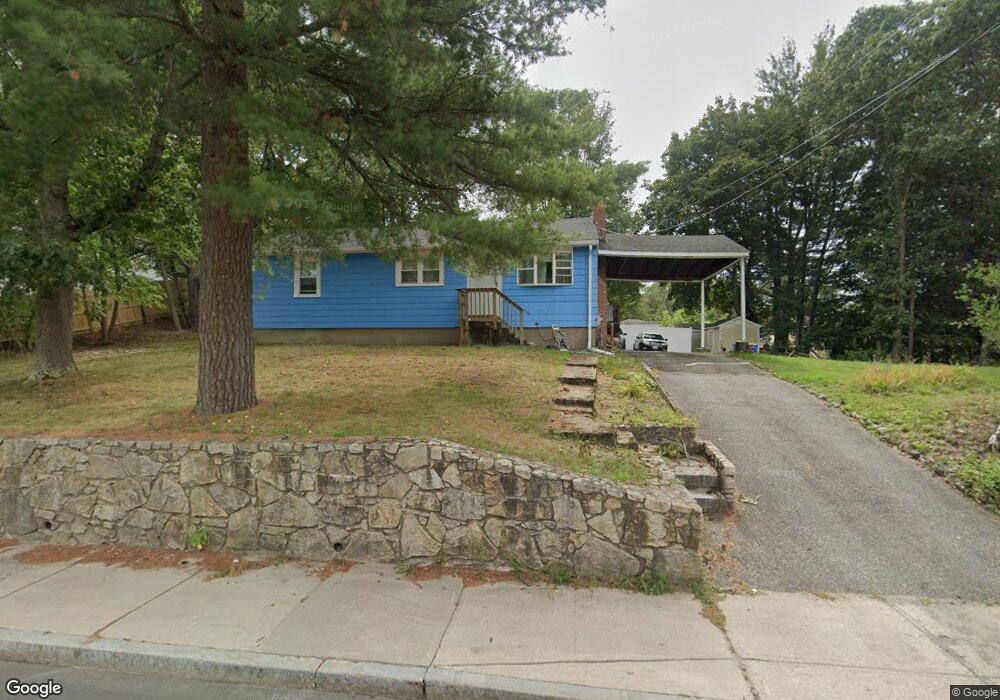
295 Union St Randolph, MA 02368
South Randolph NeighborhoodEstimated Value: $483,325 - $532,000
3
Beds
1
Bath
960
Sq Ft
$525/Sq Ft
Est. Value
About This Home
This home is located at 295 Union St, Randolph, MA 02368 and is currently estimated at $504,331, approximately $525 per square foot. 295 Union St is a home located in Norfolk County with nearby schools including Randolph High School, Boston Higashi School, and Lighthouse Baptist Christian Academy.
Ownership History
Date
Name
Owned For
Owner Type
Purchase Details
Closed on
May 6, 2005
Sold by
Mccarthy Kevin
Bought by
Nizorkov Dencho and Nizorkova Eva G I
Current Estimated Value
Home Financials for this Owner
Home Financials are based on the most recent Mortgage that was taken out on this home.
Original Mortgage
$227,200
Outstanding Balance
$119,755
Interest Rate
6.01%
Mortgage Type
Purchase Money Mortgage
Estimated Equity
$384,576
Purchase Details
Closed on
May 5, 2003
Sold by
Caruso Frank and Caruso Gertrude M
Bought by
Mccarthy Kevin
Home Financials for this Owner
Home Financials are based on the most recent Mortgage that was taken out on this home.
Original Mortgage
$195,700
Interest Rate
5.82%
Mortgage Type
Purchase Money Mortgage
Create a Home Valuation Report for This Property
The Home Valuation Report is an in-depth analysis detailing your home's value as well as a comparison with similar homes in the area
Home Values in the Area
Average Home Value in this Area
Purchase History
| Date | Buyer | Sale Price | Title Company |
|---|---|---|---|
| Nizorkov Dencho | $284,000 | -- | |
| Mccarthy Kevin | $206,000 | -- |
Source: Public Records
Mortgage History
| Date | Status | Borrower | Loan Amount |
|---|---|---|---|
| Open | Nizorkov Dencho | $227,200 | |
| Closed | Nizorkov Dencho | $56,800 | |
| Previous Owner | Mccarthy Kevin | $195,700 |
Source: Public Records
Tax History Compared to Growth
Tax History
| Year | Tax Paid | Tax Assessment Tax Assessment Total Assessment is a certain percentage of the fair market value that is determined by local assessors to be the total taxable value of land and additions on the property. | Land | Improvement |
|---|---|---|---|---|
| 2025 | $5,007 | $431,300 | $242,100 | $189,200 |
| 2024 | $4,692 | $409,800 | $237,400 | $172,400 |
| 2023 | $4,535 | $375,400 | $215,800 | $159,600 |
| 2022 | $4,398 | $323,400 | $179,900 | $143,500 |
| 2021 | $4,181 | $282,900 | $149,900 | $133,000 |
| 2020 | $4,094 | $274,600 | $149,900 | $124,700 |
| 2019 | $3,928 | $262,200 | $142,800 | $119,400 |
| 2018 | $3,721 | $234,300 | $132,300 | $102,000 |
| 2017 | $3,634 | $224,600 | $125,900 | $98,700 |
| 2016 | $3,542 | $203,700 | $114,500 | $89,200 |
| 2015 | $3,457 | $191,000 | $109,000 | $82,000 |
Source: Public Records
Map
Nearby Homes
- 327 Union St
- 314 South St
- 7 Morton Rd
- 46 Wilmarth Rd
- 346 South St
- 5 Patterson Ave E
- 229 Mill St
- 217 Mill St
- 89 Fernandez Cir
- 4 Evan Cain Way
- 10 Alfred Terrace
- 46 Union Square Unit 46
- 15 Barbara Rd
- 63 Cedarhill Rd
- 9 Madison Ave
- 43 Toscano Way Unit 43
- 5 Clarendon Cir Unit Lot 4
- 17 Mill St
- 20 Selwyn Rd
- 27 Winter St