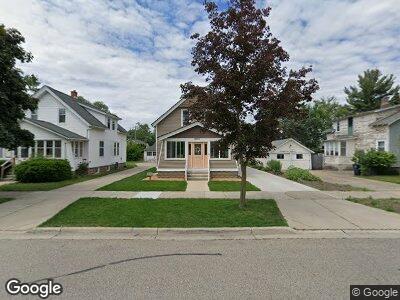
295 W 18th St Holland, MI 49423
Washington Square NeighborhoodEstimated Value: $242,000 - $266,000
3
Beds
1
Bath
1,205
Sq Ft
$211/Sq Ft
Est. Value
About This Home
This home is located at 295 W 18th St, Holland, MI 49423 and is currently estimated at $254,737, approximately $211 per square foot. 295 W 18th St is a home located in Ottawa County with nearby schools including Jefferson Elementary School, Holland High School, and Vanderbilt Charter Academy.
Ownership History
Date
Name
Owned For
Owner Type
Purchase Details
Closed on
Jun 17, 2010
Sold by
Boerman Glenn I and Boerman Marcia A
Bought by
Marshall Jessica J
Current Estimated Value
Home Financials for this Owner
Home Financials are based on the most recent Mortgage that was taken out on this home.
Original Mortgage
$72,868
Interest Rate
4.97%
Mortgage Type
FHA
Create a Home Valuation Report for This Property
The Home Valuation Report is an in-depth analysis detailing your home's value as well as a comparison with similar homes in the area
Home Values in the Area
Average Home Value in this Area
Purchase History
| Date | Buyer | Sale Price | Title Company |
|---|---|---|---|
| Marshall Jessica J | $75,000 | Lighthouse Title Inc |
Source: Public Records
Mortgage History
| Date | Status | Borrower | Loan Amount |
|---|---|---|---|
| Open | Marshall Jessica J | $19,000 | |
| Closed | Marshall Jessica J | $5,000 | |
| Open | Jessica J | $81,000 | |
| Closed | Jessica J | $15,000 | |
| Closed | Jessica J | $70,770 | |
| Closed | Marshall Jessica J | $72,868 |
Source: Public Records
Tax History Compared to Growth
Tax History
| Year | Tax Paid | Tax Assessment Tax Assessment Total Assessment is a certain percentage of the fair market value that is determined by local assessors to be the total taxable value of land and additions on the property. | Land | Improvement |
|---|---|---|---|---|
| 2024 | $1,902 | $97,500 | $0 | $0 |
| 2023 | $3,544 | $84,600 | $0 | $0 |
| 2022 | $1,662 | $81,700 | $0 | $0 |
| 2021 | $1,616 | $67,600 | $0 | $0 |
| 2020 | $1,613 | $65,500 | $0 | $0 |
| 2019 | $1,626 | $58,500 | $0 | $0 |
| 2018 | $1,531 | $50,500 | $0 | $0 |
| 2017 | $1,483 | $50,500 | $0 | $0 |
| 2016 | $1,483 | $43,700 | $0 | $0 |
| 2015 | $1,437 | $41,200 | $0 | $0 |
| 2014 | $1,437 | $38,600 | $0 | $0 |
Source: Public Records
Map
Nearby Homes