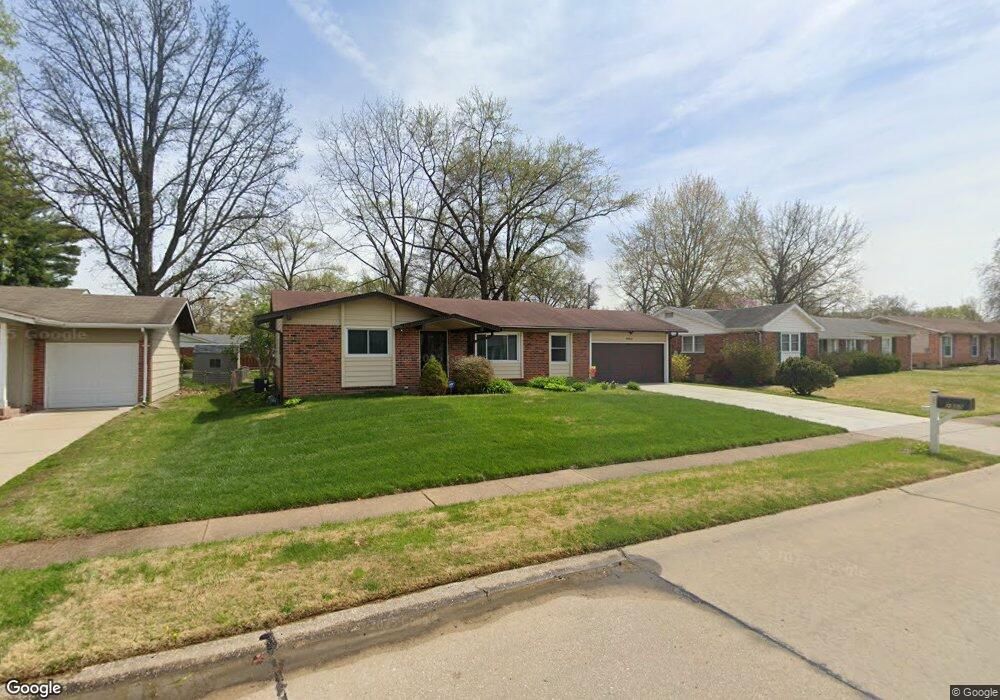
2950 Devonshire Dr Florissant, MO 63033
Estimated Value: $198,683 - $215,000
3
Beds
2
Baths
1,316
Sq Ft
$159/Sq Ft
Est. Value
About This Home
This home is located at 2950 Devonshire Dr, Florissant, MO 63033 and is currently estimated at $209,421, approximately $159 per square foot. 2950 Devonshire Dr is a home located in St. Louis County with nearby schools including Wedgwood Elementary School, Cross Keys Middle School, and McCluer North High School.
Ownership History
Date
Name
Owned For
Owner Type
Purchase Details
Closed on
Sep 19, 2003
Sold by
Carter Roy L and Carter Royce
Bought by
Fortner Sharon B
Current Estimated Value
Home Financials for this Owner
Home Financials are based on the most recent Mortgage that was taken out on this home.
Original Mortgage
$92,500
Interest Rate
6.3%
Mortgage Type
Purchase Money Mortgage
Purchase Details
Closed on
Mar 30, 2001
Sold by
Darren Stith and Darren Marnie
Bought by
Carter Roy L
Home Financials for this Owner
Home Financials are based on the most recent Mortgage that was taken out on this home.
Original Mortgage
$86,400
Interest Rate
7.13%
Purchase Details
Closed on
Dec 18, 1998
Sold by
Rivens Dennis and Bivens Terri L
Bought by
Stith Darren and Stith Marnie
Home Financials for this Owner
Home Financials are based on the most recent Mortgage that was taken out on this home.
Original Mortgage
$74,250
Interest Rate
10.2%
Create a Home Valuation Report for This Property
The Home Valuation Report is an in-depth analysis detailing your home's value as well as a comparison with similar homes in the area
Home Values in the Area
Average Home Value in this Area
Purchase History
| Date | Buyer | Sale Price | Title Company |
|---|---|---|---|
| Fortner Sharon B | $123,900 | -- | |
| Carter Roy L | $96,000 | -- | |
| Carter Roy L | -- | -- | |
| Stith Darren | $82,500 | -- |
Source: Public Records
Mortgage History
| Date | Status | Borrower | Loan Amount |
|---|---|---|---|
| Previous Owner | Fortner Sharon B | $92,500 | |
| Previous Owner | Carter Roy L | $86,400 | |
| Previous Owner | Stith Darren | $74,250 | |
| Closed | Fortner Sharon B | $25,000 |
Source: Public Records
Tax History
| Year | Tax Paid | Tax Assessment Tax Assessment Total Assessment is a certain percentage of the fair market value that is determined by local assessors to be the total taxable value of land and additions on the property. | Land | Improvement |
|---|---|---|---|---|
| 2025 | $2,408 | $33,330 | $3,780 | $29,550 |
| 2024 | $2,408 | $31,940 | $3,290 | $28,650 |
| 2023 | $2,400 | $31,940 | $3,290 | $28,650 |
| 2022 | $2,063 | $24,080 | $3,290 | $20,790 |
| 2021 | $2,056 | $24,080 | $3,290 | $20,790 |
| 2020 | $1,918 | $20,880 | $3,780 | $17,100 |
| 2019 | $1,881 | $20,880 | $3,780 | $17,100 |
| 2018 | $1,691 | $16,750 | $2,960 | $13,790 |
| 2017 | $1,682 | $16,750 | $2,960 | $13,790 |
| 2016 | $1,520 | $14,720 | $2,620 | $12,100 |
Source: Public Records
Map
Nearby Homes
- 2945 Dover Dr
- 7 Darwin Ct
- 2855 Devonshire Dr
- 2305 Belfast Dr
- 2910 Wellington Dr
- 2860 Sussex Dr
- 3115 Wellington Dr
- 2370 Indiancup Dr
- 2042 Shoreham Dr
- 2190 Glenoro Dr
- 2165 E Humes Ln
- 2843 Chapel View Dr
- 2465 Brown Ln
- 2345 Hummingbird Dr
- 514 Chapel Cross Dr
- 425 Jana Dr
- 14910 New Halls Ferry Rd
- 13 Lancaster Ct
- 340 Patterson Ln
- 490 Jana Dr
- 2960 Devonshire Dr
- 2940 Devonshire Dr
- 2965 Dover Dr
- 2975 Dover Dr
- 2955 Dover Dr
- 2930 Devonshire Dr
- 2970 Devonshire Dr
- 2955 Devonshire Dr
- 2945 Devonshire Dr
- 2260 Belfast Dr
- 2965 Devonshire Dr
- 2925 Devonshire Dr
- 2915 Devonshire Dr
- 2215 Kent Dr
- 2975 Devonshire Dr
- 2970 Dover Dr
- 2928 Castleford Dr
- 2950 Dover Dr
- 2908 Castleford Dr
- 2948 Castleford Dr
Your Personal Tour Guide
Ask me questions while you tour the home.