Estimated Value: $470,927 - $486,000
4
Beds
4
Baths
3,036
Sq Ft
$158/Sq Ft
Est. Value
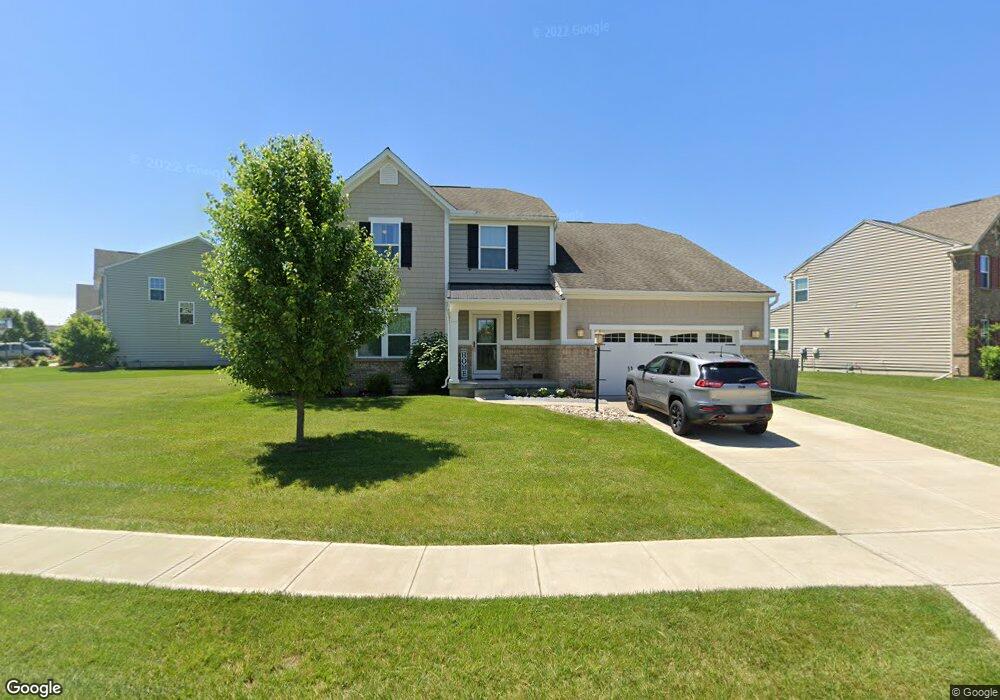
About This Home
This home is located at 2951 Ambrosia Ln, Xenia, OH 45385 and is currently estimated at $480,232, approximately $158 per square foot. 2951 Ambrosia Ln is a home located in Greene County with nearby schools including Trebein Elementary School, Jacob Coy Middle School, and Beavercreek High School.
Ownership History
Date
Name
Owned For
Owner Type
Purchase Details
Closed on
Mar 30, 2021
Sold by
Rice John and Rice Meagan
Bought by
Underwood Jacob A and Underwood Caitlin N
Current Estimated Value
Home Financials for this Owner
Home Financials are based on the most recent Mortgage that was taken out on this home.
Original Mortgage
$348,000
Outstanding Balance
$314,202
Interest Rate
3%
Mortgage Type
VA
Estimated Equity
$166,030
Purchase Details
Closed on
Jun 9, 2014
Sold by
Nvr Inc
Bought by
Rice John and Rice Meagan
Home Financials for this Owner
Home Financials are based on the most recent Mortgage that was taken out on this home.
Original Mortgage
$288,470
Interest Rate
4.2%
Mortgage Type
VA
Purchase Details
Closed on
Feb 14, 2014
Sold by
Oberer Land Developers Ltd
Bought by
Nvr Inc
Create a Home Valuation Report for This Property
The Home Valuation Report is an in-depth analysis detailing your home's value as well as a comparison with similar homes in the area
Home Values in the Area
Average Home Value in this Area
Purchase History
| Date | Buyer | Sale Price | Title Company |
|---|---|---|---|
| Underwood Jacob A | -- | None Listed On Document | |
| Rice John | $279,300 | None Available | |
| Nvr Inc | $65,600 | None Available |
Source: Public Records
Mortgage History
| Date | Status | Borrower | Loan Amount |
|---|---|---|---|
| Open | Underwood Jacob A | $348,000 | |
| Previous Owner | Rice John | $288,470 |
Source: Public Records
Tax History Compared to Growth
Tax History
| Year | Tax Paid | Tax Assessment Tax Assessment Total Assessment is a certain percentage of the fair market value that is determined by local assessors to be the total taxable value of land and additions on the property. | Land | Improvement |
|---|---|---|---|---|
| 2024 | $7,991 | $134,810 | $26,760 | $108,050 |
| 2023 | $7,991 | $134,810 | $26,760 | $108,050 |
| 2022 | $7,662 | $112,870 | $22,300 | $90,570 |
| 2021 | $7,719 | $112,460 | $22,300 | $90,160 |
| 2020 | $7,765 | $112,460 | $22,300 | $90,160 |
| 2019 | $7,902 | $105,020 | $23,010 | $82,010 |
| 2018 | $6,957 | $105,020 | $23,010 | $82,010 |
| 2017 | $6,404 | $105,020 | $23,010 | $82,010 |
| 2016 | $6,317 | $98,430 | $20,130 | $78,300 |
| 2015 | $6,356 | $98,430 | $20,130 | $78,300 |
Source: Public Records
Map
Nearby Homes
- 1281 Whitetail Dr
- 1878 Spring Meadows Dr
- 1788 Fawnwood Ct
- 1922 Spring Ridge Dr
- 1105 Windsong Trail
- 1395 Brookstone Dr
- 1800 Ash Meadow Ct
- 508 Glenhaven Way Unit 756-300
- 2450 Beaver Valley Rd
- 516 Glenhaven Way Unit 756-304
- 506 Glenhaven Way Unit 756-204
- 502 Glenhaven Way Unit 756-202
- 510 Glenhaven Way Unit 756-301
- 500 Glenhaven Way Unit 756-201
- 456 Glenhaven Way Unit 754-304
- 464 Glenhaven Way Unit 755-203
- 474 Glenhaven Way Unit 755-303
- 518 Glenhaven Way Unit 756-305
- 470 Glenhaven Way Unit 755-301
- 462 Glenhaven Way Unit 755-202
- 2957 Ambrosia Ln E
- 2941 Ambrosia Ln E
- 2952 Ambrosia Ln E
- 2956 Ambrosia Ln E
- 2959 Ambrosia Ln
- 2964 Ambrosia Ln
- 2950 Ambrosia Ln
- 2946 Ambrosia Ln
- 2966 Ambrosia Ln E
- 2940 Ambrosia Ln E
- 2933 Ambrosia Ln E
- 2948 Ambrosia Ln
- 2968 Ambrosia Ln
- 137 Ambrosia Ln
- 97 Ambrosia Ln E
- 2934 Ambrosia Ln E
- 2942 Ambrosia Ln
- 2936 Ambrosia Ln
- 2927 Ambrosia Ln E
- 2930 Ambrosia Ln