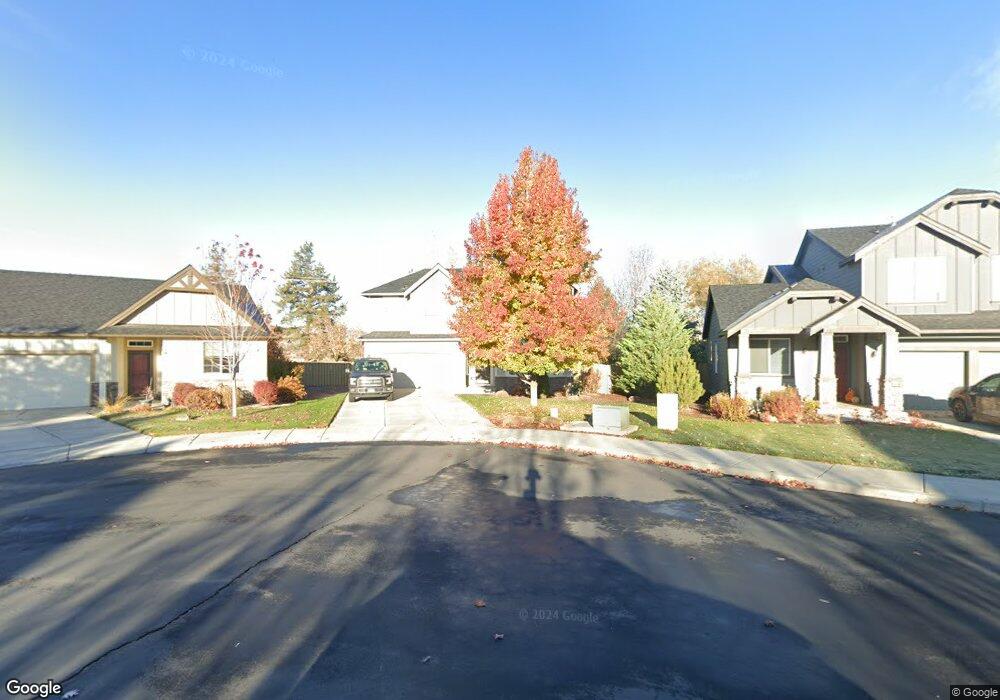
2951 SW 50th Ct Unit 19 Redmond, OR 97756
Estimated Value: $630,825 - $700,000
3
Beds
3
Baths
2,461
Sq Ft
$265/Sq Ft
Est. Value
About This Home
This home is located at 2951 SW 50th Ct Unit 19, Redmond, OR 97756 and is currently estimated at $653,206, approximately $265 per square foot. 2951 SW 50th Ct Unit 19 is a home located in Deschutes County with nearby schools including Sage Elementary School, Obsidian Middle School, and Ridgeview High School.
Ownership History
Date
Name
Owned For
Owner Type
Purchase Details
Closed on
Oct 9, 2025
Sold by
Shaun R And Diane M Hannay Trust and Hannay Shaun R
Bought by
Arnsberg Tim and Arnsberg Dawn
Current Estimated Value
Home Financials for this Owner
Home Financials are based on the most recent Mortgage that was taken out on this home.
Original Mortgage
$603,250
Outstanding Balance
$603,250
Interest Rate
6.35%
Mortgage Type
New Conventional
Estimated Equity
$49,956
Purchase Details
Closed on
Jul 19, 2022
Sold by
Hannay Shaun R
Bought by
Shaun R And Diane M Hannay Trust
Purchase Details
Closed on
Sep 12, 2014
Sold by
Austin Robert G and Austin Nancy
Bought by
Hannay Shaun R and Hannay Diane M
Home Financials for this Owner
Home Financials are based on the most recent Mortgage that was taken out on this home.
Original Mortgage
$148,950
Interest Rate
4.09%
Mortgage Type
New Conventional
Purchase Details
Closed on
Jul 12, 2010
Sold by
Austin Brett J
Bought by
Austin Robert G and Austin Nancy
Purchase Details
Closed on
Dec 14, 2009
Sold by
D R Horton Inc Portland
Bought by
Austin Brett J
Create a Home Valuation Report for This Property
The Home Valuation Report is an in-depth analysis detailing your home's value as well as a comparison with similar homes in the area
Home Values in the Area
Average Home Value in this Area
Purchase History
| Date | Buyer | Sale Price | Title Company |
|---|---|---|---|
| Arnsberg Tim | $634,999 | First American Title | |
| Shaun R And Diane M Hannay Trust | -- | None Listed On Document | |
| Hannay Shaun R | $279,950 | First American Title | |
| Austin Robert G | -- | Accommodation | |
| Austin Brett J | $196,000 | First American Title |
Source: Public Records
Mortgage History
| Date | Status | Borrower | Loan Amount |
|---|---|---|---|
| Open | Arnsberg Tim | $603,250 | |
| Previous Owner | Hannay Shaun R | $148,950 |
Source: Public Records
Tax History Compared to Growth
Tax History
| Year | Tax Paid | Tax Assessment Tax Assessment Total Assessment is a certain percentage of the fair market value that is determined by local assessors to be the total taxable value of land and additions on the property. | Land | Improvement |
|---|---|---|---|---|
| 2025 | $5,739 | $281,470 | -- | -- |
| 2024 | $5,506 | $273,280 | -- | -- |
| 2023 | $5,266 | $265,330 | $0 | $0 |
| 2022 | $4,787 | $250,110 | $0 | $0 |
| 2021 | $4,629 | $242,830 | $0 | $0 |
| 2020 | $4,420 | $242,830 | $0 | $0 |
| 2019 | $4,227 | $235,760 | $0 | $0 |
| 2018 | $4,122 | $228,900 | $0 | $0 |
| 2017 | $4,024 | $222,240 | $0 | $0 |
| 2016 | $3,968 | $215,770 | $0 | $0 |
| 2015 | $3,847 | $209,490 | $0 | $0 |
| 2014 | $3,745 | $203,390 | $0 | $0 |
Source: Public Records
Map
Nearby Homes
- 4677 SW Volcano Ave
- 3111 SW 46th St
- 4847 SW Zenith Ave
- 4778 SW Zenith Ave
- 2511 SW 43rd Ct
- 2449 SW 43rd St
- 3511 SW 43rd St
- 2155 SW 43rd St Unit Lot 15
- 2111 SW 43rd St Unit Lot 13
- 2133 SW 43rd St Unit Lot 14
- 3192 SW 41st St
- 4129 SW Majestic Ave
- 4469 SW Antelope Ave
- 4337 SW Rhyolite Place Unit Lot 19
- 4315 SW Rhyolite Place Unit Lot 18
- 3769 SW 43rd St
- 4317 SW Reindeer Ave Unit Lot 11
- 2917 SW 37th Ct
- 3344 SW Cascade Vista Dr
- 3734 SW Wickiup Place
- 2941 SW 50th Ct
- 2941 SW 50th Ct Unit 18
- 2961 SW 50th Ct
- 2961 SW 50th Ct Unit 20
- 2903 SW 50th St
- 2903 SW 50th St Unit 17
- 2971 SW 50th St
- 2893 SW 50th St Unit 16
- 2893 SW 50th St
- 2971 SW 50th Ct
- 2971 SW 50th Ct Unit 21
- 2952 SW 50th Ct
- 2952 SW 50th Ct Unit 23
- 2962 SW 50th Ct
- 2962 SW 50th Ct Unit 22
- 2943 SW 50th St Unit 24
- 2873 SW 50th St Unit 15
- 2873 SW 50th St
- 2924 SW 50th St Unit 30