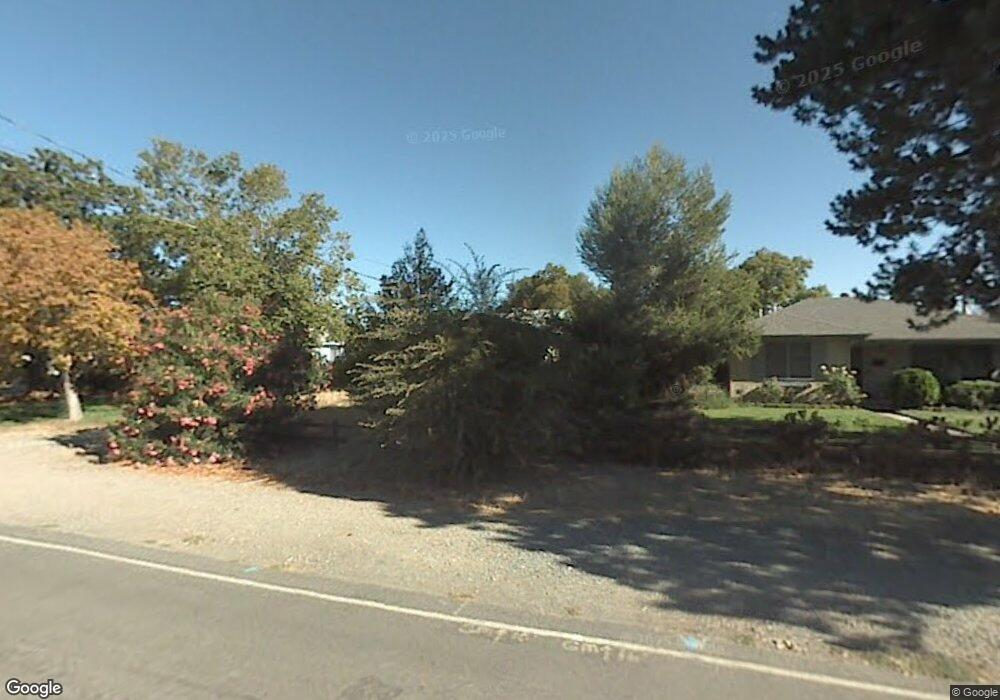
2953 Euclid Ave Concord, CA 94519
Parkside NeighborhoodEstimated Value: $589,000 - $830,000
4
Beds
2
Baths
1,608
Sq Ft
$441/Sq Ft
Est. Value
About This Home
This home is located at 2953 Euclid Ave, Concord, CA 94519 and is currently estimated at $709,500, approximately $441 per square foot. 2953 Euclid Ave is a home located in Contra Costa County with nearby schools including Wren Avenue Elementary School, El Dorado Middle School, and Mt. Diablo High School.
Ownership History
Date
Name
Owned For
Owner Type
Purchase Details
Closed on
Dec 11, 2015
Sold by
Ramireddy Anupama and Ramireddy Keshav
Bought by
Broadmoor Properties Llc
Current Estimated Value
Purchase Details
Closed on
Aug 21, 2015
Sold by
Huang Zhen Ting and Cai Bao Ru
Bought by
Ramireddy Anupama and Ramireddy Keshav
Home Financials for this Owner
Home Financials are based on the most recent Mortgage that was taken out on this home.
Original Mortgage
$410,000
Interest Rate
4.05%
Mortgage Type
New Conventional
Purchase Details
Closed on
Nov 7, 2006
Sold by
Black Dorothy F
Bought by
Huang Zhen Ting and Cai Bao Ru
Home Financials for this Owner
Home Financials are based on the most recent Mortgage that was taken out on this home.
Original Mortgage
$390,000
Interest Rate
6.28%
Mortgage Type
Purchase Money Mortgage
Purchase Details
Closed on
Aug 2, 1996
Sold by
Black Dorothy F
Bought by
Black Dorothy F
Create a Home Valuation Report for This Property
The Home Valuation Report is an in-depth analysis detailing your home's value as well as a comparison with similar homes in the area
Home Values in the Area
Average Home Value in this Area
Purchase History
| Date | Buyer | Sale Price | Title Company |
|---|---|---|---|
| Broadmoor Properties Llc | $125,000 | None Available | |
| Ramireddy Anupama | $560,000 | Old Republic Title Company | |
| Huang Zhen Ting | $520,000 | Old Republic Title Company | |
| Black Dorothy F | -- | -- |
Source: Public Records
Mortgage History
| Date | Status | Borrower | Loan Amount |
|---|---|---|---|
| Previous Owner | Ramireddy Anupama | $410,000 | |
| Previous Owner | Huang Zhen Ting | $390,000 |
Source: Public Records
Tax History
| Year | Tax Paid | Tax Assessment Tax Assessment Total Assessment is a certain percentage of the fair market value that is determined by local assessors to be the total taxable value of land and additions on the property. | Land | Improvement |
|---|---|---|---|---|
| 2025 | $3,394 | $298,314 | $298,314 | -- |
| 2024 | $3,274 | $292,465 | $292,465 | -- |
| 2023 | $4,794 | $286,731 | $286,731 | $0 |
| 2022 | $4,717 | $281,109 | $281,109 | $0 |
| 2021 | $7,672 | $612,439 | $437,457 | $174,982 |
| 2019 | $7,528 | $594,276 | $424,483 | $169,793 |
| 2018 | $7,245 | $582,624 | $416,160 | $166,464 |
| 2017 | $7,007 | $571,200 | $408,000 | $163,200 |
| 2016 | $6,820 | $560,000 | $400,000 | $160,000 |
| 2015 | $7,951 | $659,157 | $523,942 | $135,215 |
| 2014 | $7,829 | $646,246 | $513,679 | $132,567 |
Source: Public Records
Map
Nearby Homes
- 2947 Concord Blvd
- 1848 Parkside Dr
- 1861 Parkside Dr
- 2850 Concord Blvd
- 3195 Willow Pass Rd
- 3336 Euclid Ave
- 2601 Sinclair Ave Unit 6
- 1954 N 6th St
- 3162 Salvio St
- 1715 Copperleaf Ct
- 2640 Wisteria Way
- 2837 Bonifacio St
- 3466 Willow Pass Rd Unit 54
- 2109 N 6th St
- 3479 Rose Ct
- 1901 Jacqueline Way
- 2105 Holbrook Dr
- 3124 Mount Diablo St
- 1812 Baldwin Dr
- 3622 Delancey Ln
- 2955 Euclid Ave
- 2951 Euclid Ave
- 1839 Mcnorth Dr
- 2943 Euclid Ave
- 3001 Euclid Ave
- 1840 Mcnorth Dr
- 2947 Euclid Ave
- 1842 Mcnorth Dr
- 1850 Euclid Ct
- 1856 Euclid Ct
- 2945 Euclid Ave
- 2952 Euclid Ave
- 2956 Euclid Ave
- 2948 Euclid Ave Unit 2950
- 1862 Euclid Ct
- 2986 Euclid Ave
- 2944 Euclid Ave
- 3011 Euclid Ave
- 1846 Mcnorth Dr
- 1868 Euclid Ct
Your Personal Tour Guide
Ask me questions while you tour the home.