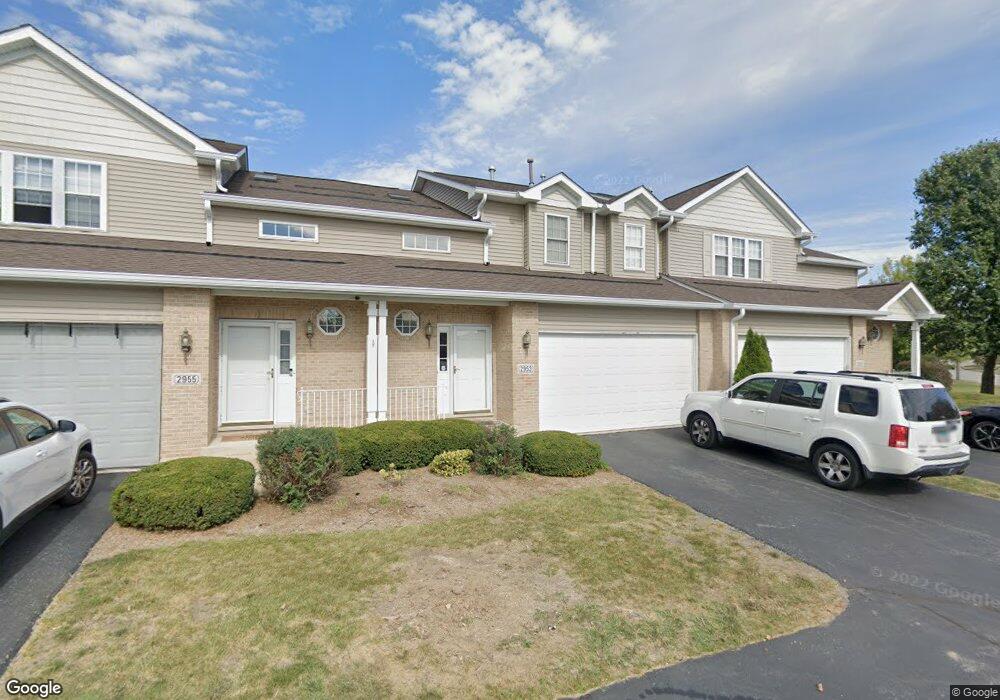
2953 Old Renwick Cir Plainfield, IL 60544
Crystal Lawns NeighborhoodEstimated Value: $290,000 - $331,000
3
Beds
3
Baths
1,692
Sq Ft
$179/Sq Ft
Est. Value
About This Home
This home is located at 2953 Old Renwick Cir, Plainfield, IL 60544 and is currently estimated at $303,402, approximately $179 per square foot. 2953 Old Renwick Cir is a home located in Will County with nearby schools including Central Elementary School, Indian Trail Middle School, and Plainfield Central High School.
Ownership History
Date
Name
Owned For
Owner Type
Purchase Details
Closed on
Apr 18, 2017
Sold by
Piazza Michael D and Piazza Sarah A
Bought by
Opaluwa Mohammed and Atojoko Ibrahim Berikisu
Current Estimated Value
Home Financials for this Owner
Home Financials are based on the most recent Mortgage that was taken out on this home.
Original Mortgage
$7,500
Outstanding Balance
$6,244
Interest Rate
4.14%
Mortgage Type
Stand Alone Second
Estimated Equity
$297,158
Purchase Details
Closed on
Dec 30, 2005
Sold by
Peron Ronald J and Peron Susan
Bought by
Piazza Michael D and Piazza Sarah A
Home Financials for this Owner
Home Financials are based on the most recent Mortgage that was taken out on this home.
Original Mortgage
$157,120
Interest Rate
6.42%
Mortgage Type
Fannie Mae Freddie Mac
Create a Home Valuation Report for This Property
The Home Valuation Report is an in-depth analysis detailing your home's value as well as a comparison with similar homes in the area
Home Values in the Area
Average Home Value in this Area
Purchase History
| Date | Buyer | Sale Price | Title Company |
|---|---|---|---|
| Opaluwa Mohammed | $180,000 | Baird & Warner Title Svcs In | |
| Piazza Michael D | $196,500 | Chicago Title Insurance Comp |
Source: Public Records
Mortgage History
| Date | Status | Borrower | Loan Amount |
|---|---|---|---|
| Open | Opaluwa Mohammed | $7,500 | |
| Open | Opaluwa Mohammed | $174,600 | |
| Previous Owner | Piazza Michael D | $157,120 |
Source: Public Records
Tax History Compared to Growth
Tax History
| Year | Tax Paid | Tax Assessment Tax Assessment Total Assessment is a certain percentage of the fair market value that is determined by local assessors to be the total taxable value of land and additions on the property. | Land | Improvement |
|---|---|---|---|---|
| 2024 | $4,934 | $76,890 | $8,754 | $68,136 |
| 2023 | $4,934 | $69,445 | $7,906 | $61,539 |
| 2022 | $4,463 | $62,828 | $7,153 | $55,675 |
| 2021 | $4,219 | $58,718 | $6,685 | $52,033 |
| 2020 | $4,150 | $57,052 | $6,495 | $50,557 |
| 2019 | $3,997 | $54,361 | $6,189 | $48,172 |
| 2018 | $3,631 | $48,920 | $5,815 | $43,105 |
| 2017 | $3,512 | $46,489 | $5,526 | $40,963 |
| 2016 | $3,734 | $47,735 | $5,270 | $42,465 |
| 2015 | $3,464 | $44,717 | $4,937 | $39,780 |
| 2014 | $3,464 | $43,138 | $4,763 | $38,375 |
| 2013 | $3,464 | $43,138 | $4,763 | $38,375 |
Source: Public Records
Map
Nearby Homes
- 12 Dan Ireland Dr Unit 13
- 3114 Hillary Ct
- Lot #3 S End Rd
- 3714 Harms Rd
- 21546 Victory Lake Way Unit 8
- 3511 Sumac Dr
- 21531 Wolf Lake Way
- 21522 Lake st Clair Dr
- 514 S Stone Bluff Dr
- 1973 W Crestview Cir
- 1986 W Brimstone Rd Unit 1
- 21533 Cormorant St
- 21543 Eich Dr
- 16012 Carillon Lakes Ct
- 669 Bridgeman Ln Unit 1
- 16400 Crescent Lake Dr
- 16416 Crescent Lake Ct
- 2033 Wedgewood Cir
- 412 Rachel Cir Unit 7
- 16453 Timberview Dr
- 2955 Old Renwick Cir
- 2955 Old Renwick Cir Unit 2955
- 2951 Old Renwick Cir
- 2957 Old Renwick Cir
- 2957 Old Renwick Cir Unit 2957
- 2961 Old Renwick Cir
- 2963 Old Renwick Cir
- 2965 Old Renwick Cir
- 2967 Old Renwick Cir
- 3915 Pathfinder Ln
- 3913 Pathfinder Ln
- 21949 W Renwick Rd
- 2971 Old Renwick Cir
- 3911 Pathfinder Ln
- 21949 Old Renwick Rd
- 2973 Old Renwick Cir
- 2975 Old Renwick Cir
- 3907 Pathfinder Ln
- 3905 Pathfinder Ln
- 2977 Old Renwick Cir