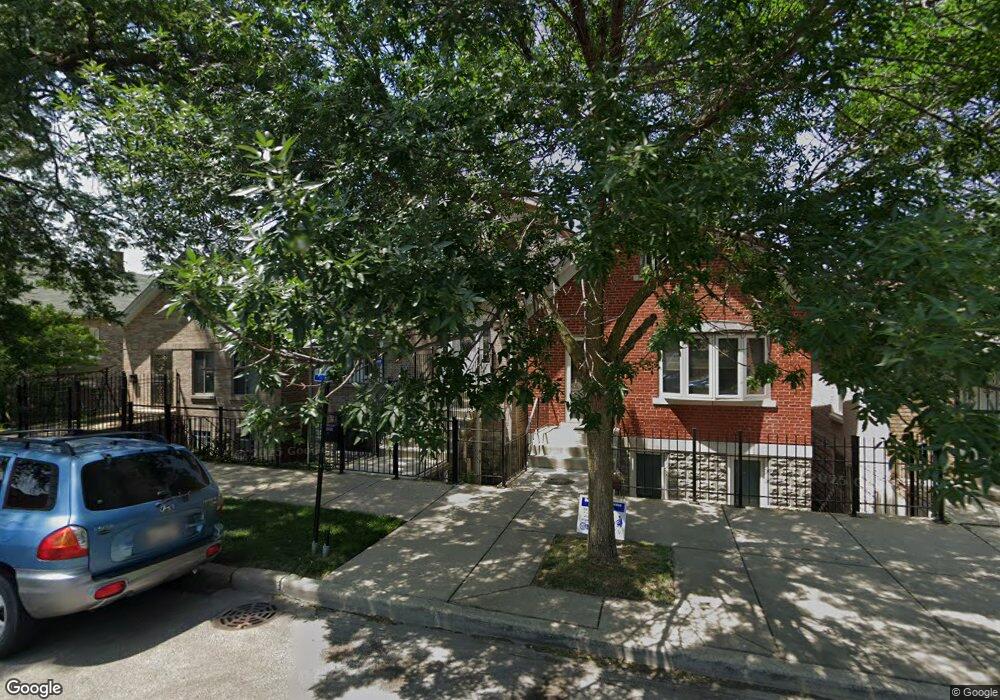
2954 S Lyman St Chicago, IL 60608
Bridgeport NeighborhoodEstimated Value: $493,308 - $681,000
3
Beds
3
Baths
2,237
Sq Ft
$262/Sq Ft
Est. Value
About This Home
This home is located at 2954 S Lyman St, Chicago, IL 60608 and is currently estimated at $585,077, approximately $261 per square foot. 2954 S Lyman St is a home located in Cook County with nearby schools including Holden Elementary School, St Therese School West, and St Barbara Elementary School.
Ownership History
Date
Name
Owned For
Owner Type
Purchase Details
Closed on
May 6, 2008
Sold by
Perez Humberto
Bought by
Perez Humberto and Perez Luz
Current Estimated Value
Home Financials for this Owner
Home Financials are based on the most recent Mortgage that was taken out on this home.
Original Mortgage
$225,000
Outstanding Balance
$142,864
Interest Rate
5.93%
Mortgage Type
New Conventional
Estimated Equity
$442,213
Purchase Details
Closed on
Jul 25, 1996
Sold by
The Chicago Trust Company
Bought by
Perez Humberto
Home Financials for this Owner
Home Financials are based on the most recent Mortgage that was taken out on this home.
Original Mortgage
$94,939
Interest Rate
8.33%
Mortgage Type
FHA
Create a Home Valuation Report for This Property
The Home Valuation Report is an in-depth analysis detailing your home's value as well as a comparison with similar homes in the area
Home Values in the Area
Average Home Value in this Area
Purchase History
| Date | Buyer | Sale Price | Title Company |
|---|---|---|---|
| Perez Humberto | -- | Cst | |
| Perez Humberto | $95,000 | 1St American Title |
Source: Public Records
Mortgage History
| Date | Status | Borrower | Loan Amount |
|---|---|---|---|
| Open | Perez Humberto | $225,000 | |
| Closed | Perez Humberto | $94,939 |
Source: Public Records
Tax History Compared to Growth
Tax History
| Year | Tax Paid | Tax Assessment Tax Assessment Total Assessment is a certain percentage of the fair market value that is determined by local assessors to be the total taxable value of land and additions on the property. | Land | Improvement |
|---|---|---|---|---|
| 2024 | $7,107 | $46,000 | $12,375 | $33,625 |
| 2023 | $6,907 | $37,000 | $10,000 | $27,000 |
| 2022 | $6,907 | $37,000 | $10,000 | $27,000 |
| 2021 | $6,771 | $37,000 | $10,000 | $27,000 |
| 2020 | $6,294 | $31,356 | $8,000 | $23,356 |
| 2019 | $6,311 | $34,841 | $8,000 | $26,841 |
| 2018 | $6,204 | $34,841 | $8,000 | $26,841 |
| 2017 | $4,484 | $24,206 | $6,250 | $17,956 |
| 2016 | $4,348 | $24,206 | $6,250 | $17,956 |
| 2015 | $3,955 | $24,206 | $6,250 | $17,956 |
| 2014 | $3,754 | $22,800 | $5,000 | $17,800 |
| 2013 | $3,532 | $22,800 | $5,000 | $17,800 |
Source: Public Records
Map
Nearby Homes
- 2948 S Lyman St
- 2922 S Keeley St
- 2837 S Farrell St
- 2879 S Throop St
- 2947 S Farrell St
- 2935 S Throop St
- 2819 S Quinn St
- 2812 S Quinn St
- 4936 S Loomis St
- 2725 S Quinn St
- 2850 S Poplar Ave
- 1226 W 31st Place
- 2713 S Crowell St
- 1312 W 31st St
- 928 W 29th St
- 2520 S Stark St
- 3212 S Aberdeen St
- 1019 W 32nd St
- 3217 S May St
- 3128 S Lituanica Ave
- 2950 S Lyman St
- 2956 S Lyman St
- 2946 S Lyman St
- 2942 S Lyman St
- 2971 S Bonfield St
- 2962 S Lyman St
- 2868 S Keeley St
- 2868 S Keeley St Unit 2
- 2969 S Bonfield St
- 2866 S Keeley St
- 2967 S Bonfield St
- 2864 S Keeley St
- 2963 S Bonfield St
- 2943 S Lyman St
- 2932 S Lyman St
- 2955 S Lyman St
- 2945 S Lyman St
- 2963 S Lyman St
- 2963 S Lyman St
- 2949 S Lyman St