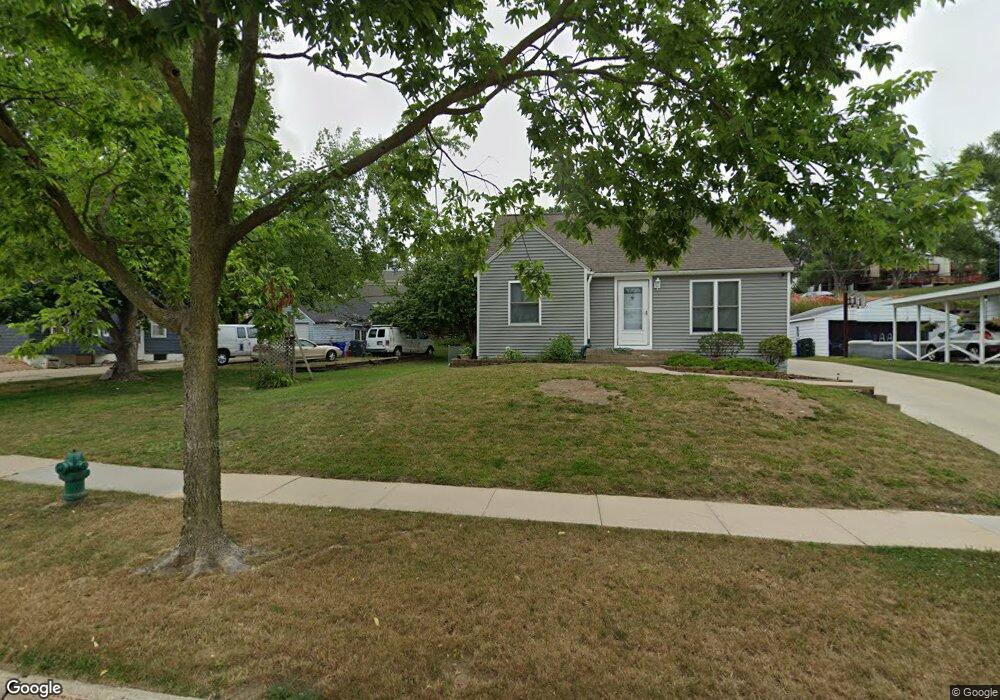
2955 Bowling St SW Cedar Rapids, IA 52404
Southwest Area NeighborhoodEstimated Value: $108,000 - $131,000
2
Beds
1
Bath
948
Sq Ft
$122/Sq Ft
Est. Value
About This Home
This home is located at 2955 Bowling St SW, Cedar Rapids, IA 52404 and is currently estimated at $115,782, approximately $122 per square foot. 2955 Bowling St SW is a home located in Linn County with nearby schools including Prairie Heights Elementary School, Prairie Crest Elementary School, and Prairie View Elementary School.
Ownership History
Date
Name
Owned For
Owner Type
Purchase Details
Closed on
Nov 25, 2019
Sold by
Chamberlin Vanessa Sue
Bought by
Bateman Kimberly
Current Estimated Value
Home Financials for this Owner
Home Financials are based on the most recent Mortgage that was taken out on this home.
Original Mortgage
$82,450
Outstanding Balance
$72,548
Interest Rate
3.5%
Mortgage Type
New Conventional
Estimated Equity
$43,234
Purchase Details
Closed on
May 2, 2017
Sold by
Dietze Lisa M
Bought by
Chamberlin Vanessa Sue
Home Financials for this Owner
Home Financials are based on the most recent Mortgage that was taken out on this home.
Original Mortgage
$11,850
Interest Rate
4.1%
Mortgage Type
Purchase Money Mortgage
Purchase Details
Closed on
Feb 24, 2003
Sold by
First Community Trust Na and Rehak Daniel A
Bought by
Dietze Lisa M
Create a Home Valuation Report for This Property
The Home Valuation Report is an in-depth analysis detailing your home's value as well as a comparison with similar homes in the area
Home Values in the Area
Average Home Value in this Area
Purchase History
| Date | Buyer | Sale Price | Title Company |
|---|---|---|---|
| Bateman Kimberly | $85,000 | River Ridge Escrow Co | |
| Chamberlin Vanessa Sue | $79,000 | None Available | |
| Dietze Lisa M | $63,000 | -- |
Source: Public Records
Mortgage History
| Date | Status | Borrower | Loan Amount |
|---|---|---|---|
| Open | Bateman Kimberly | $82,450 | |
| Previous Owner | Chamberlin Vanessa Sue | $11,850 | |
| Previous Owner | Chamberlin Vanessa Sue | $67,150 |
Source: Public Records
Tax History Compared to Growth
Tax History
| Year | Tax Paid | Tax Assessment Tax Assessment Total Assessment is a certain percentage of the fair market value that is determined by local assessors to be the total taxable value of land and additions on the property. | Land | Improvement |
|---|---|---|---|---|
| 2025 | $1,558 | $105,000 | $18,000 | $87,000 |
| 2024 | $1,710 | $92,700 | $13,000 | $79,700 |
| 2023 | $1,710 | $92,700 | $13,000 | $79,700 |
| 2022 | $1,676 | $86,100 | $13,000 | $73,100 |
| 2021 | $1,596 | $86,100 | $13,000 | $73,100 |
| 2020 | $1,596 | $78,700 | $13,000 | $65,700 |
| 2019 | $1,730 | $77,100 | $13,000 | $64,100 |
| 2018 | $1,378 | $77,100 | $13,000 | $64,100 |
| 2017 | $1,551 | $62,000 | $4,000 | $58,000 |
| 2016 | $1,551 | $71,700 | $4,000 | $67,700 |
| 2015 | $1,565 | $72,771 | $4,000 | $68,771 |
| 2014 | $1,378 | $70,749 | $4,000 | $66,749 |
| 2013 | -- | $70,749 | $4,000 | $66,749 |
Source: Public Records
Map
Nearby Homes
- 2955 Bowling St SW Unit E238
- 51 29th Avenue Dr SW Unit D11
- 51 29th Avenue Dr SW Unit C22
- 3010 Bowling St SW
- 109 Evelyn Dr SW
- 42 Park Village Ave SW
- 2937 Southland St SW
- 2818 Southland St SW
- 3212 Southland St SW
- 9 33rd Ave SW
- 2601 Teresa Dr SW
- 90 29th Ave SW
- 148 33rd Ave SW
- 2321 Lauren Dr SW
- 2212 Deborah Dr SW
- 186 22nd Ave SW
- 2021 Hamilton St SW
- Lot A-D 41st Avenue Dr SW
- 2536 L St SW
- 1804 I St SW
- 2955 Bowling St SW Unit 135
- 2955 Bowling St SW Unit 232
- 2955 Bowling St SW Unit E239
- 2955 Bowling St SW Unit E237
- 2955 Bowling St SW Unit E236
- 2955 Bowling St SW Unit 23
- 2955 Bowling St SW
- 2955 Bowling St SW
- 2955 Bowling St SW Unit E140
- 2955 Bowling St SW Unit 13
- 2955 Bowling St SW
- 2955 Bowling St SW
- 2955 Bowling St SW
- 2955 Bowling St SW
- 2955 Bowling St SW
- 2955 Bowling St SW
- 2955 Bowling St SW
- 2955 Bowling St SW Unit E240
- 2955 Bowling St SW Unit 138
- 2955 Bowling St SW Unit 133