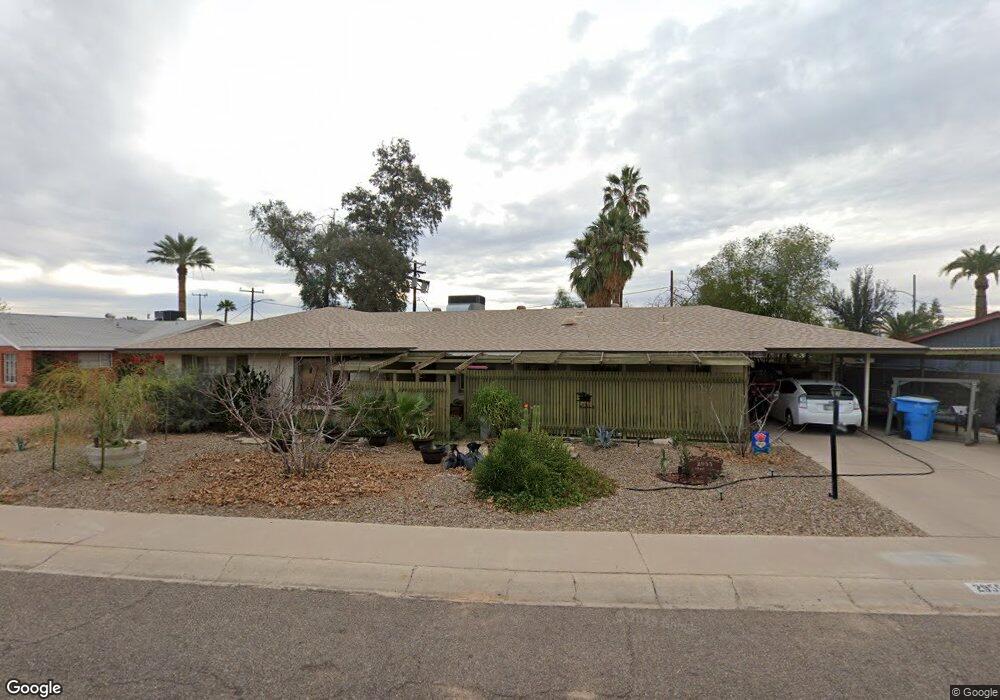
2955 N 22nd Ave Phoenix, AZ 85015
North Encanto NeighborhoodEstimated Value: $437,428 - $554,000
3
Beds
4
Baths
2,535
Sq Ft
$194/Sq Ft
Est. Value
About This Home
This home is located at 2955 N 22nd Ave, Phoenix, AZ 85015 and is currently estimated at $491,607, approximately $193 per square foot. 2955 N 22nd Ave is a home located in Maricopa County with nearby schools including Maie Bartlett Heard Elementary School, Phoenix Coding Academy, and Central High School.
Ownership History
Date
Name
Owned For
Owner Type
Purchase Details
Closed on
Jun 19, 2003
Sold by
Freeman Mary Kay
Bought by
Burch Charles and Burch Margaret R
Current Estimated Value
Home Financials for this Owner
Home Financials are based on the most recent Mortgage that was taken out on this home.
Original Mortgage
$127,200
Outstanding Balance
$54,059
Interest Rate
5.37%
Mortgage Type
New Conventional
Estimated Equity
$437,548
Purchase Details
Closed on
Apr 4, 1997
Sold by
Bacon Curtiss Stow and Saucedo Jon P
Bought by
Freeman Mary Kay
Home Financials for this Owner
Home Financials are based on the most recent Mortgage that was taken out on this home.
Original Mortgage
$64,000
Interest Rate
7.86%
Mortgage Type
New Conventional
Create a Home Valuation Report for This Property
The Home Valuation Report is an in-depth analysis detailing your home's value as well as a comparison with similar homes in the area
Home Values in the Area
Average Home Value in this Area
Purchase History
| Date | Buyer | Sale Price | Title Company |
|---|---|---|---|
| Burch Charles | $159,000 | Lawyers Title Insurance Corp | |
| Freeman Mary Kay | $124,000 | Transnation Title Ins Co |
Source: Public Records
Mortgage History
| Date | Status | Borrower | Loan Amount |
|---|---|---|---|
| Open | Burch Charles | $127,200 | |
| Previous Owner | Freeman Mary Kay | $64,000 |
Source: Public Records
Tax History
| Year | Tax Paid | Tax Assessment Tax Assessment Total Assessment is a certain percentage of the fair market value that is determined by local assessors to be the total taxable value of land and additions on the property. | Land | Improvement |
|---|---|---|---|---|
| 2025 | $2,333 | $18,449 | -- | -- |
| 2024 | $2,166 | $17,570 | -- | -- |
| 2023 | $2,166 | $35,400 | $7,080 | $28,320 |
| 2022 | $2,083 | $27,670 | $5,530 | $22,140 |
| 2021 | $2,085 | $24,900 | $4,980 | $19,920 |
| 2020 | $2,115 | $23,730 | $4,740 | $18,990 |
| 2019 | $2,116 | $20,950 | $4,190 | $16,760 |
| 2018 | $2,078 | $19,450 | $3,890 | $15,560 |
| 2017 | $2,004 | $16,430 | $3,280 | $13,150 |
| 2016 | $1,642 | $15,860 | $3,170 | $12,690 |
| 2015 | $1,496 | $14,650 | $2,930 | $11,720 |
Source: Public Records
Map
Nearby Homes
- 3001 N 21st Ave
- 2219 W Catalina Dr
- 2915 N 21st Ave
- 2314 W Pinchot Ave
- 2233 W Flower St
- 2740 N 21st Dr
- 2222 W Flower St
- 2055 W Edgemont Ave
- 2147 W Osborn Rd
- 2985 N 19th Ave Unit 11
- 2039 W Windsor Ave
- 2055 W Windsor Ave
- 2013 W Windsor Ave
- 2134 W Mitchell Dr
- 3152 N 24th Dr
- 2205 W Cambridge Ave
- 2917 N 19th Ave Unit 128
- 2917 N 19th Ave Unit 114
- 2917 N 19th Ave Unit 115
- 1813 W Earll Dr
- 2125 W Pinchot Ave
- 2949 N 22nd Ave
- 2122 W Catalina Dr
- 2944 N 21st Dr
- 2201 W Pinchot Ave
- 2119 W Pinchot Ave
- 2202 W Catalina Dr
- 2116 W Catalina Dr
- 2937 N 22nd Ave
- 2130 W Pinchot Ave
- 2209 W Pinchot Ave
- 2938 N 21st Dr
- 2136 W Pinchot Ave
- 2124 W Pinchot Ave
- 2111 W Pinchot Ave
- 2110 W Catalina Dr
- 2208 W Catalina Dr
- 2202 W Pinchot Ave
- 2201 W Catalina Dr
- 2215 W Pinchot Ave
Your Personal Tour Guide
Ask me questions while you tour the home.