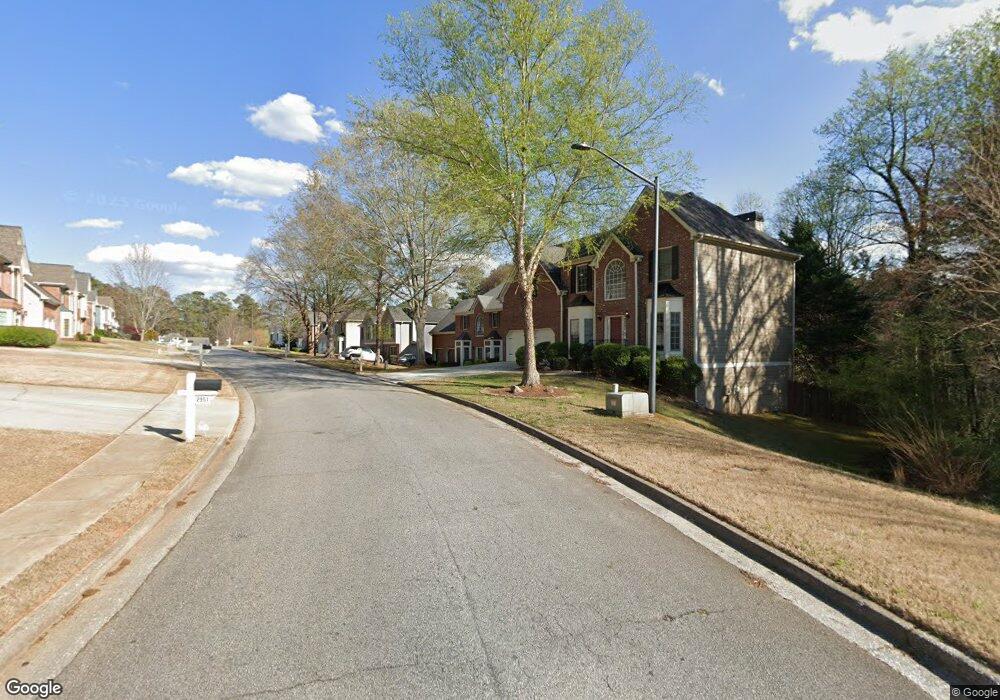
2956 Montview Dr SW Unit 44 Marietta, GA 30060
Southwestern Marietta NeighborhoodEstimated Value: $436,000 - $496,000
4
Beds
3
Baths
2,420
Sq Ft
$193/Sq Ft
Est. Value
About This Home
This home is located at 2956 Montview Dr SW Unit 44, Marietta, GA 30060 and is currently estimated at $466,550, approximately $192 per square foot. 2956 Montview Dr SW Unit 44 is a home located in Cobb County with nearby schools including Birney Elementary School, Floyd Middle School, and Osborne High School.
Ownership History
Date
Name
Owned For
Owner Type
Purchase Details
Closed on
Aug 29, 2024
Sold by
Herrington Robert L
Bought by
Herrington Robert L
Current Estimated Value
Purchase Details
Closed on
Nov 20, 2014
Sold by
Mccue Laura Ann
Bought by
Herrington Robert L
Home Financials for this Owner
Home Financials are based on the most recent Mortgage that was taken out on this home.
Original Mortgage
$139,500
Outstanding Balance
$106,353
Interest Rate
3.95%
Mortgage Type
New Conventional
Estimated Equity
$360,197
Purchase Details
Closed on
Jun 29, 2004
Sold by
W & H Properties Llc
Bought by
Mccue Laura A
Home Financials for this Owner
Home Financials are based on the most recent Mortgage that was taken out on this home.
Original Mortgage
$208,905
Interest Rate
6.25%
Mortgage Type
New Conventional
Create a Home Valuation Report for This Property
The Home Valuation Report is an in-depth analysis detailing your home's value as well as a comparison with similar homes in the area
Home Values in the Area
Average Home Value in this Area
Purchase History
| Date | Buyer | Sale Price | Title Company |
|---|---|---|---|
| Herrington Robert L | -- | None Listed On Document | |
| Herrington Robert L | $184,000 | -- | |
| Mccue Laura A | $219,900 | -- |
Source: Public Records
Mortgage History
| Date | Status | Borrower | Loan Amount |
|---|---|---|---|
| Open | Herrington Robert L | $139,500 | |
| Previous Owner | Mccue Laura A | $208,905 |
Source: Public Records
Tax History Compared to Growth
Tax History
| Year | Tax Paid | Tax Assessment Tax Assessment Total Assessment is a certain percentage of the fair market value that is determined by local assessors to be the total taxable value of land and additions on the property. | Land | Improvement |
|---|---|---|---|---|
| 2025 | $6,202 | $214,864 | $40,000 | $174,864 |
| 2024 | $6,478 | $214,864 | $40,000 | $174,864 |
| 2023 | $5,191 | $172,188 | $32,000 | $140,188 |
| 2022 | $3,303 | $108,832 | $32,000 | $76,832 |
| 2021 | $3,303 | $108,832 | $32,000 | $76,832 |
| 2020 | $3,220 | $106,104 | $18,000 | $88,104 |
| 2019 | $3,029 | $99,808 | $14,800 | $85,008 |
| 2018 | $3,029 | $99,808 | $14,800 | $85,008 |
| 2017 | $2,087 | $72,600 | $16,000 | $56,600 |
| 2016 | $2,087 | $72,600 | $16,000 | $56,600 |
| 2015 | $2,139 | $72,600 | $16,000 | $56,600 |
| 2014 | $1,756 | $67,924 | $0 | $0 |
Source: Public Records
Map
Nearby Homes
- 2969 Favor Rd SW Unit 1
- 825 Winfield Ct SW
- 959 Old Milford Church Rd SW
- 2940 Caller Ct SW
- 537 Shay Dr SW Unit 9
- 2760 Hicks Rd SW
- 800 Grindstone Place SW
- 1020 Hicksmil Dr SW
- 444 White Oak Dr SW
- 3241 Wildwood Dr SW
- 2907 Crest Ridge Ct SW
- 881 Whittington Pkwy
- 430 Church Rd SW
- 3421 Mill Stream Ln SW Unit 3
- 3308 Wildwood Dr SW
- 3427 Mill Stream Ln SW
- 3065 Moser Way
- 3141 Holbrook Dr SW
- 3090 Moser Way
- 2956 Montview Dr SW
- 2960 Montview Dr SW
- 2952 Montview Dr SW
- 2964 Montview Dr SW
- 2964 Montview Dr SW Unit 18,5
- 2955 Montview Dr SW
- 2959 Montview Dr SW Unit 1
- 2951 Montview Dr SW
- 2968 Montview Dr SW
- 2948 Montview Dr SW
- 780 Smyrna Powder Springs Rd SW
- 2963 Montview Dr SW
- 2947 Montview Dr SW
- 2967 Montview Dr SW
- 2972 Montview Dr SW
- 2943 Montview Dr SW
- 2944 Montview Dr SW
- 2984 Montview Dr SW
- 2996 Montview Dr SW
- 2939 Montview Dr SW