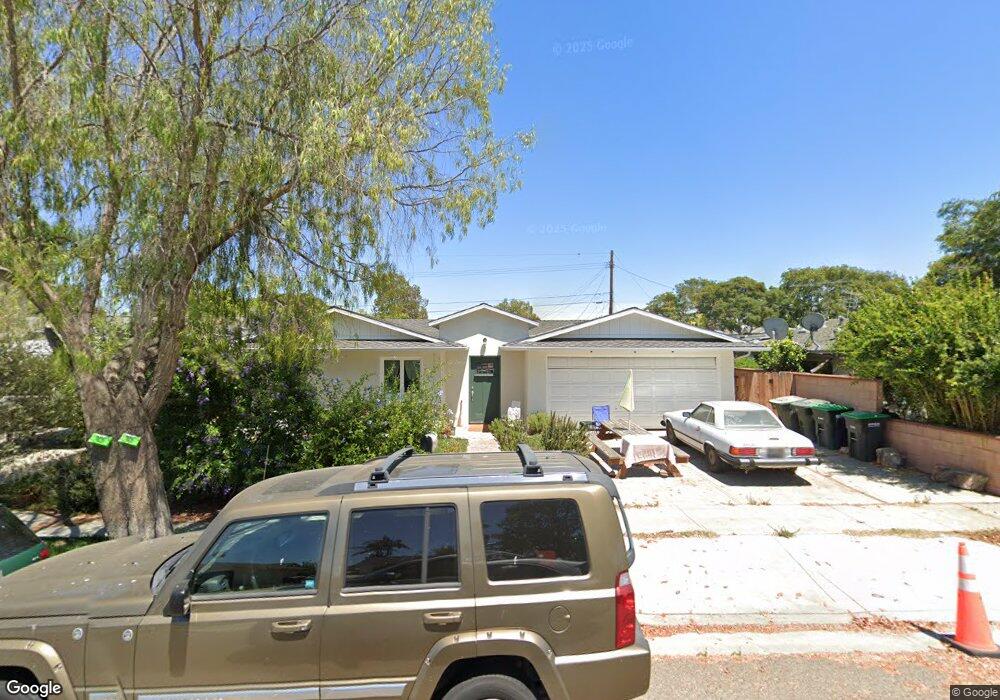
2958 Croftdon St Costa Mesa, CA 92626
Estimated Value: $1,046,000 - $1,642,000
3
Beds
2
Baths
1,000
Sq Ft
$1,318/Sq Ft
Est. Value
About This Home
This home is located at 2958 Croftdon St, Costa Mesa, CA 92626 and is currently estimated at $1,318,154, approximately $1,318 per square foot. 2958 Croftdon St is a home located in Orange County with nearby schools including Sonora Elementary School, Costa Mesa High School, and St. John the Baptist Catholic School.
Ownership History
Date
Name
Owned For
Owner Type
Purchase Details
Closed on
Nov 3, 1999
Sold by
Smaniotto Marc A and Smaniotto Rebecca A
Bought by
Green Ronald John and Green Ulrike Matthies
Current Estimated Value
Home Financials for this Owner
Home Financials are based on the most recent Mortgage that was taken out on this home.
Original Mortgage
$176,000
Outstanding Balance
$53,444
Interest Rate
7.68%
Estimated Equity
$1,264,710
Purchase Details
Closed on
Oct 12, 1993
Sold by
Smaniotto Marc A and Smaniotto Marc
Bought by
Smaniotto Marc A and Smaniotto Rebecca A
Home Financials for this Owner
Home Financials are based on the most recent Mortgage that was taken out on this home.
Original Mortgage
$135,000
Interest Rate
6.95%
Create a Home Valuation Report for This Property
The Home Valuation Report is an in-depth analysis detailing your home's value as well as a comparison with similar homes in the area
Purchase History
| Date | Buyer | Sale Price | Title Company |
|---|---|---|---|
| Green Ronald John | $220,000 | American Title Co | |
| Smaniotto Marc A | -- | Chicago Title Company |
Source: Public Records
Mortgage History
| Date | Status | Borrower | Loan Amount |
|---|---|---|---|
| Open | Green Ronald John | $176,000 | |
| Previous Owner | Smaniotto Marc A | $135,000 |
Source: Public Records
Tax History
| Year | Tax Paid | Tax Assessment Tax Assessment Total Assessment is a certain percentage of the fair market value that is determined by local assessors to be the total taxable value of land and additions on the property. | Land | Improvement |
|---|---|---|---|---|
| 2025 | $5,449 | $437,327 | $276,001 | $161,326 |
| 2024 | $5,449 | $428,752 | $270,589 | $158,163 |
| 2023 | $5,251 | $420,346 | $265,284 | $155,062 |
| 2022 | $5,052 | $412,104 | $260,082 | $152,022 |
| 2021 | $4,401 | $357,579 | $254,982 | $102,597 |
| 2020 | $4,158 | $336,186 | $252,367 | $83,819 |
| 2019 | $3,789 | $303,112 | $247,419 | $55,693 |
| 2018 | $3,712 | $297,169 | $242,568 | $54,601 |
| 2017 | $3,652 | $291,343 | $237,812 | $53,531 |
| 2016 | $3,577 | $285,631 | $233,149 | $52,482 |
| 2015 | $3,541 | $281,341 | $229,647 | $51,694 |
| 2014 | $3,462 | $275,830 | $225,148 | $50,682 |
Source: Public Records
Map
Nearby Homes
- 944 Tesla Ln
- 970 Valencia St
- 1016 Valencia St
- 917 Helena Cir
- 3012 Garfield Ave
- 3032 Grant Ave
- 1030 Palmetto Way
- 952 Cheyenne St
- 895 Sonora Rd
- 825 Sonora Rd
- 810 Baker St Unit 112
- 2836 Portola Dr
- 3084 Taylor Way
- 913 Junipero Dr
- 781 Grayling Bay
- 783 Grayling
- 832 Presidio Dr
- 2702 San Lucas Ln
- 3157 Cork Ln
- 1096 Tulare Dr
Your Personal Tour Guide
Ask me questions while you tour the home.