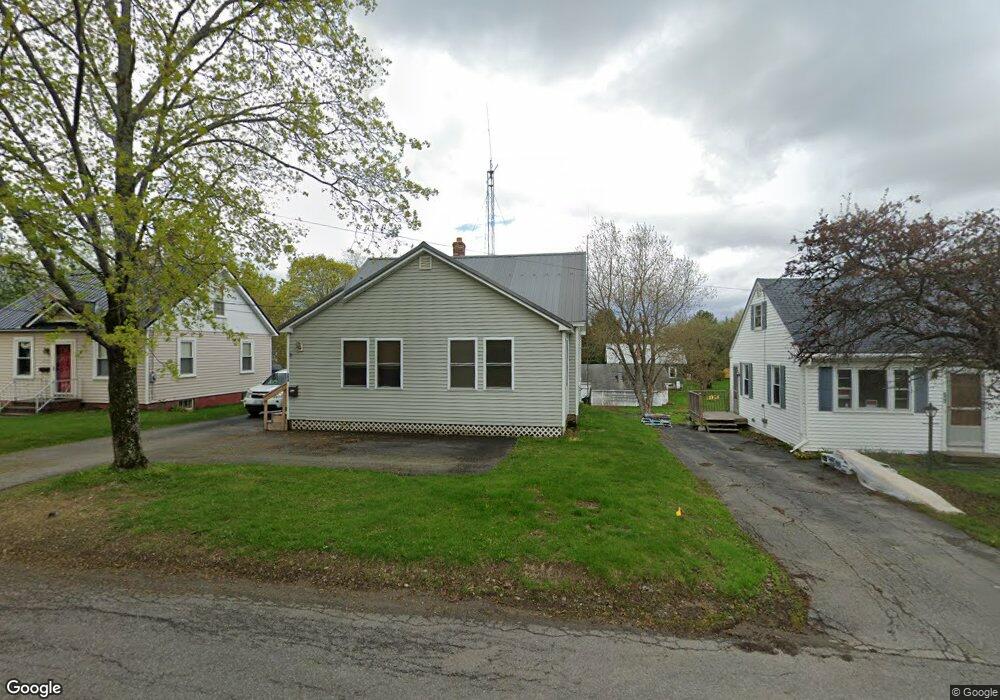
296 Maple St Bangor, ME 04401
Tree Streets NeighborhoodEstimated Value: $156,000 - $244,508
4
Beds
1
Bath
1,068
Sq Ft
$190/Sq Ft
Est. Value
About This Home
This home is located at 296 Maple St, Bangor, ME 04401 and is currently estimated at $202,877, approximately $189 per square foot. 296 Maple St is a home located in Penobscot County with nearby schools including Fruit Street School, Mary Snow School, and William S. Cohen School.
Ownership History
Date
Name
Owned For
Owner Type
Purchase Details
Closed on
Jul 25, 2019
Sold by
Engelhardt David
Bought by
Logan Pamela
Current Estimated Value
Purchase Details
Closed on
May 1, 2019
Sold by
Peoples United Bank Na
Bought by
Engelhardt Gerhard F Est
Purchase Details
Closed on
Apr 23, 2019
Sold by
Engelhardt Gerhard F Est
Bought by
Engelhardt David
Purchase Details
Closed on
Oct 2, 2017
Sold by
Bangor City Of
Bought by
Peoples United Bank Na
Purchase Details
Closed on
Sep 19, 2017
Sold by
Bangor City Of
Bought by
Engethard Gerhard F
Create a Home Valuation Report for This Property
The Home Valuation Report is an in-depth analysis detailing your home's value as well as a comparison with similar homes in the area
Home Values in the Area
Average Home Value in this Area
Purchase History
| Date | Buyer | Sale Price | Title Company |
|---|---|---|---|
| Logan Pamela | -- | -- | |
| Engelhardt Gerhard F Est | -- | -- | |
| Engelhardt David | -- | -- | |
| Peoples United Bank Na | -- | -- | |
| Engethard Gerhard F | -- | -- |
Source: Public Records
Tax History Compared to Growth
Tax History
| Year | Tax Paid | Tax Assessment Tax Assessment Total Assessment is a certain percentage of the fair market value that is determined by local assessors to be the total taxable value of land and additions on the property. | Land | Improvement |
|---|---|---|---|---|
| 2024 | $2,705 | $145,800 | $22,000 | $123,800 |
| 2023 | $2,442 | $127,500 | $21,100 | $106,400 |
| 2022 | $2,319 | $113,700 | $21,100 | $92,600 |
| 2021 | $2,159 | $96,800 | $19,500 | $77,300 |
| 2020 | $2,097 | $90,400 | $18,600 | $71,800 |
| 2019 | $2,026 | $88,100 | $18,600 | $69,500 |
| 2018 | $1,974 | $86,000 | $18,600 | $67,400 |
| 2017 | $1,881 | $84,200 | $18,600 | $65,600 |
| 2016 | $1,863 | $82,800 | $18,600 | $64,200 |
| 2015 | $1,817 | $82,800 | $18,600 | $64,200 |
| 2014 | $1,755 | $80,500 | $18,600 | $61,900 |
| 2013 | $1,691 | $81,300 | $18,600 | $62,700 |
Source: Public Records
Map
Nearby Homes