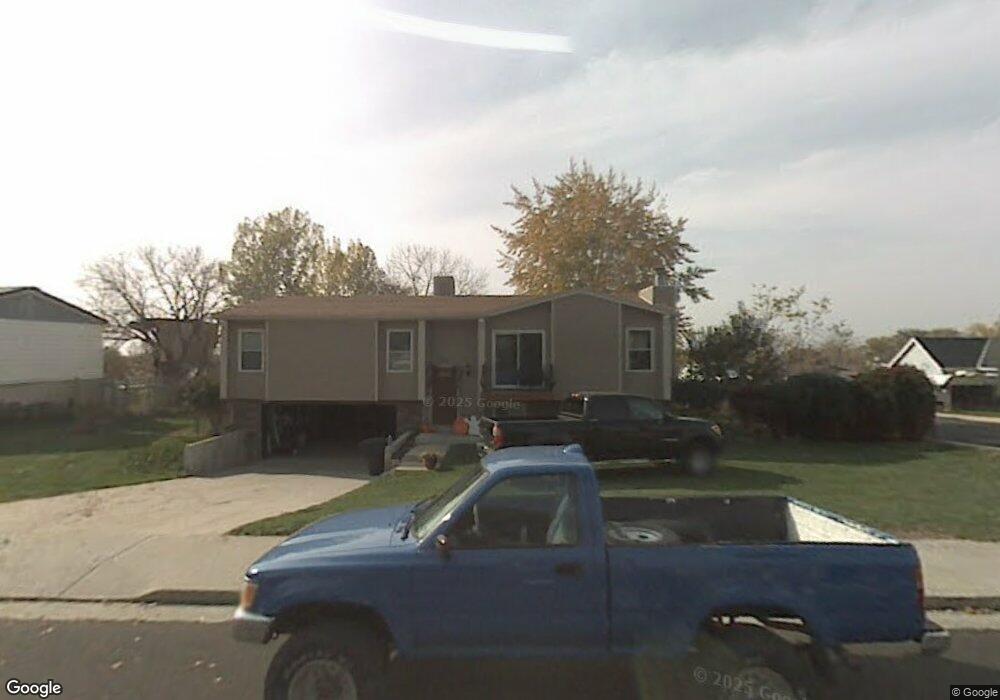
296 S 1065 W Orem, UT 84058
Orem Park NeighborhoodEstimated Value: $520,000 - $548,000
4
Beds
3
Baths
2,044
Sq Ft
$260/Sq Ft
Est. Value
About This Home
This home is located at 296 S 1065 W, Orem, UT 84058 and is currently estimated at $532,110, approximately $260 per square foot. 296 S 1065 W is a home located in Utah County with nearby schools including Orem Elementary School, Orem Junior High School, and Mountain View High School.
Ownership History
Date
Name
Owned For
Owner Type
Purchase Details
Closed on
Jun 8, 2020
Sold by
Biondo Frank
Bought by
Blondo Frank and Blondo Marissa
Current Estimated Value
Home Financials for this Owner
Home Financials are based on the most recent Mortgage that was taken out on this home.
Original Mortgage
$250,500
Outstanding Balance
$222,049
Interest Rate
3.2%
Mortgage Type
New Conventional
Estimated Equity
$310,061
Purchase Details
Closed on
May 7, 2018
Sold by
Dabling Barton A and Dabling Janice W
Bought by
Biondo Frank
Home Financials for this Owner
Home Financials are based on the most recent Mortgage that was taken out on this home.
Original Mortgage
$249,000
Interest Rate
4.44%
Mortgage Type
New Conventional
Create a Home Valuation Report for This Property
The Home Valuation Report is an in-depth analysis detailing your home's value as well as a comparison with similar homes in the area
Home Values in the Area
Average Home Value in this Area
Purchase History
| Date | Buyer | Sale Price | Title Company |
|---|---|---|---|
| Blondo Frank | -- | Vanguard Title Ins Agcy Llc | |
| Biondo Frank | -- | Eagle Gate Title Ins Agency |
Source: Public Records
Mortgage History
| Date | Status | Borrower | Loan Amount |
|---|---|---|---|
| Open | Blondo Frank | $250,500 | |
| Previous Owner | Biondo Frank | $249,000 |
Source: Public Records
Tax History
| Year | Tax Paid | Tax Assessment Tax Assessment Total Assessment is a certain percentage of the fair market value that is determined by local assessors to be the total taxable value of land and additions on the property. | Land | Improvement |
|---|---|---|---|---|
| 2025 | $1,976 | $262,515 | -- | -- |
| 2024 | $1,976 | $241,670 | $0 | $0 |
| 2023 | $1,819 | $239,030 | $0 | $0 |
| 2022 | $2,004 | $255,200 | $0 | $0 |
| 2021 | $1,866 | $359,800 | $172,900 | $186,900 |
| 2020 | $1,696 | $321,500 | $138,300 | $183,200 |
| 2019 | $1,459 | $287,600 | $127,700 | $159,900 |
| 2018 | $1,329 | $250,300 | $110,000 | $140,300 |
| 2017 | $1,220 | $123,090 | $0 | $0 |
| 2016 | $1,183 | $110,055 | $0 | $0 |
| 2015 | $1,173 | $103,180 | $0 | $0 |
| 2014 | $1,161 | $101,640 | $0 | $0 |
Source: Public Records
Map
Nearby Homes
- 278 S 1160 W
- 155 S 1200 W Unit 69
- 155 S 1200 W Unit 6
- 155 S 1200 W Unit 97
- 935 W 360 S
- 350 S 1200 W Unit 2
- 288 S 800 W
- 1041 W 600 S
- 896 W 30 S
- 506 S 800 West St Unit 13
- 520 S 800 W Unit 14
- 570 S 800 West St Unit 15
- 1110 W 105 N
- 1225 W 160 N
- 277 N 1030 W
- 222 N 1200 W Unit 144
- 222 N 1200 W Unit 84
- 565 W 40 N
- 1463 W 730 S
- 508 W 40 N
Your Personal Tour Guide
Ask me questions while you tour the home.