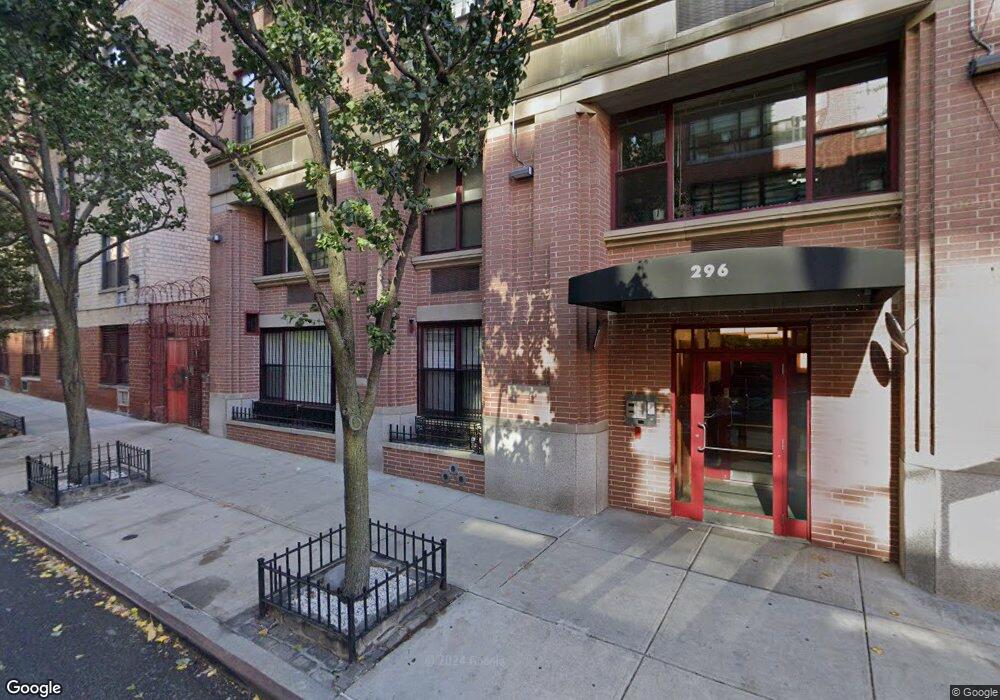
296 W 10th St Unit 7N298 New York, NY 10014
West Village NeighborhoodEstimated Value: $2,173,322 - $3,682,000
--
Bed
--
Bath
1,310
Sq Ft
$2,223/Sq Ft
Est. Value
About This Home
This home is located at 296 W 10th St Unit 7N298, New York, NY 10014 and is currently estimated at $2,912,331, approximately $2,223 per square foot. 296 W 10th St Unit 7N298 is a home located in New York County with nearby schools including P.S. 3 Charrette School, Middle School 297, and Clinton School.
Ownership History
Date
Name
Owned For
Owner Type
Purchase Details
Closed on
Jul 6, 2012
Sold by
Mehring Christine and Mehring Paul
Bought by
Wanner Andrew L
Current Estimated Value
Home Financials for this Owner
Home Financials are based on the most recent Mortgage that was taken out on this home.
Original Mortgage
$1,560,000
Outstanding Balance
$1,078,374
Interest Rate
3.7%
Mortgage Type
Purchase Money Mortgage
Estimated Equity
$1,833,957
Purchase Details
Closed on
Jul 23, 2004
Sold by
Mcdermott Martha R and Mcdermott Richard B
Bought by
Mehring Christine and Mehring Paul
Home Financials for this Owner
Home Financials are based on the most recent Mortgage that was taken out on this home.
Original Mortgage
$1,000,000
Interest Rate
6.2%
Mortgage Type
Purchase Money Mortgage
Create a Home Valuation Report for This Property
The Home Valuation Report is an in-depth analysis detailing your home's value as well as a comparison with similar homes in the area
Home Values in the Area
Average Home Value in this Area
Purchase History
| Date | Buyer | Sale Price | Title Company |
|---|---|---|---|
| Wanner Andrew L | $1,950,000 | -- | |
| Wanner Andrew L | $1,950,000 | -- | |
| Mehring Christine | $1,450,000 | -- | |
| Mehring Christine | $1,450,000 | -- |
Source: Public Records
Mortgage History
| Date | Status | Borrower | Loan Amount |
|---|---|---|---|
| Open | Wanner Andrew L | $1,560,000 | |
| Closed | Wanner Andrew L | $1,560,000 | |
| Previous Owner | Mehring Christine | $1,000,000 |
Source: Public Records
Tax History Compared to Growth
Tax History
| Year | Tax Paid | Tax Assessment Tax Assessment Total Assessment is a certain percentage of the fair market value that is determined by local assessors to be the total taxable value of land and additions on the property. | Land | Improvement |
|---|---|---|---|---|
| 2025 | $25,383 | $202,217 | $73,105 | $129,112 |
| 2024 | $25,383 | $203,032 | $73,105 | $129,927 |
| 2023 | $20,471 | $202,273 | $73,105 | $129,168 |
| 2022 | $19,779 | $195,947 | $73,105 | $122,842 |
| 2021 | $23,800 | $194,020 | $73,105 | $120,915 |
| 2020 | $20,290 | $216,764 | $73,105 | $143,659 |
| 2019 | $19,495 | $201,746 | $73,105 | $128,641 |
| 2018 | $23,021 | $195,569 | $73,105 | $122,464 |
| 2017 | $22,329 | $187,200 | $73,104 | $114,096 |
| 2016 | $22,274 | $189,543 | $73,105 | $116,438 |
| 2015 | $13,520 | $167,687 | $73,105 | $94,582 |
| 2014 | $13,520 | $169,878 | $73,105 | $96,773 |
Source: Public Records
Map
Nearby Homes
- 5 Weehawken St Unit 4B
- 304 W 10th St Unit 4B
- 165 Christopher St Unit 6M
- 165 Christopher St Unit 2-K
- 638 Washington St Unit 2B
- 150 Barrow St Unit PH-A
- 636 Washington St Unit 4 B
- 642 Washington St Unit 4 B
- 129 Barrow St Unit 3A
- 133 Barrow St Unit 3B
- 131 Barrow St Unit GB
- 125 Barrow St Unit 4B
- 379 West St Unit 2B
- 680 Washington St Unit 1B
- 376 West St Unit GB
- 376 West St Unit 5B
- 150 Charles St Unit 14B
- 150 Charles St Unit 4AN
- 150 Charles St Unit 7CN
- 150 Charles St Unit 2CS
- 296 W 10th St Unit 10
- 296 W 10th St Unit 298
- 296 W 10th St Unit 9S298
- 296 W 10th St Unit 9N298
- 296 W 10th St Unit 8S298
- 296 W 10th St Unit 8N298
- 296 W 10th St Unit 7S298
- 296 W 10th St Unit 6S298
- 296 W 10th St Unit 6N298
- 296 W 10th St Unit 5S298
- 296 W 10th St Unit 5N298
- 296 W 10th St Unit 4S298
- 296 W 10th St Unit 4N298
- 296 W 10th St Unit 3S298
- 296 W 10th St Unit 3N298
- 296 W 10th St Unit 2S298
- 296 W 10th St Unit 2N298
- 296 W 10th St Unit 1W298
- 296 W 10th St Unit 1E298
- 296 W 10th St Unit 1N298