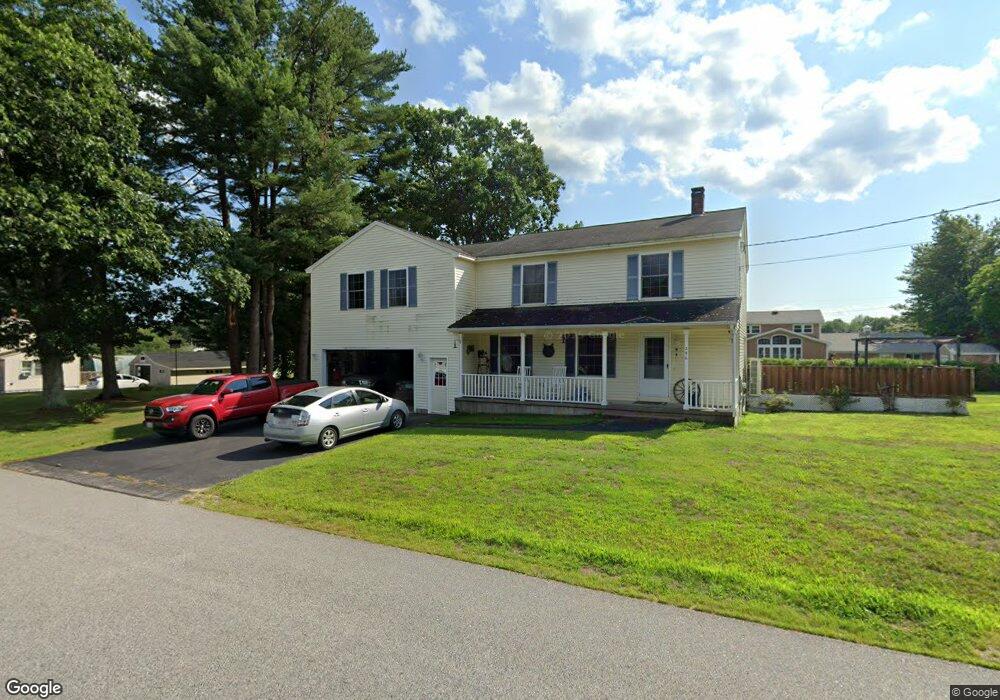
296 West St Biddeford, ME 04005
South Biddeford NeighborhoodEstimated Value: $549,000 - $716,000
4
Beds
3
Baths
2,016
Sq Ft
$300/Sq Ft
Est. Value
About This Home
This home is located at 296 West St, Biddeford, ME 04005 and is currently estimated at $605,787, approximately $300 per square foot. 296 West St is a home located in York County with nearby schools including John F Kennedy Memorial School, Biddeford Primary School, and Biddeford Intermediate School.
Ownership History
Date
Name
Owned For
Owner Type
Purchase Details
Closed on
Jun 30, 2009
Sold by
Lavoie Scott N
Bought by
Lavoie Amanda
Current Estimated Value
Home Financials for this Owner
Home Financials are based on the most recent Mortgage that was taken out on this home.
Original Mortgage
$198,125
Outstanding Balance
$126,722
Interest Rate
4.92%
Mortgage Type
FHA
Estimated Equity
$479,065
Create a Home Valuation Report for This Property
The Home Valuation Report is an in-depth analysis detailing your home's value as well as a comparison with similar homes in the area
Home Values in the Area
Average Home Value in this Area
Purchase History
| Date | Buyer | Sale Price | Title Company |
|---|---|---|---|
| Lavoie Amanda | -- | -- | |
| Lavoie Amanda | -- | -- |
Source: Public Records
Mortgage History
| Date | Status | Borrower | Loan Amount |
|---|---|---|---|
| Open | Lavoie Amanda | $198,125 | |
| Closed | Lavoie Amanda | $198,125 |
Source: Public Records
Tax History Compared to Growth
Tax History
| Year | Tax Paid | Tax Assessment Tax Assessment Total Assessment is a certain percentage of the fair market value that is determined by local assessors to be the total taxable value of land and additions on the property. | Land | Improvement |
|---|---|---|---|---|
| 2024 | $6,015 | $423,000 | $158,900 | $264,100 |
| 2023 | $5,513 | $420,200 | $156,100 | $264,100 |
| 2022 | $5,382 | $328,000 | $105,200 | $222,800 |
| 2021 | $5,035 | $276,200 | $89,000 | $187,200 |
| 2020 | $4,501 | $249,000 | $77,600 | $171,400 |
| 2019 | $4,975 | $249,000 | $77,600 | $171,400 |
| 2018 | $4,905 | $249,000 | $77,600 | $171,400 |
| 2017 | $4,877 | $243,000 | $77,600 | $165,400 |
| 2016 | $4,826 | $243,000 | $77,600 | $165,400 |
| 2015 | $4,537 | $243,000 | $77,600 | $165,400 |
| 2014 | $4,425 | $243,000 | $77,600 | $165,400 |
| 2013 | -- | $228,000 | $69,500 | $158,500 |
Source: Public Records
Map
Nearby Homes