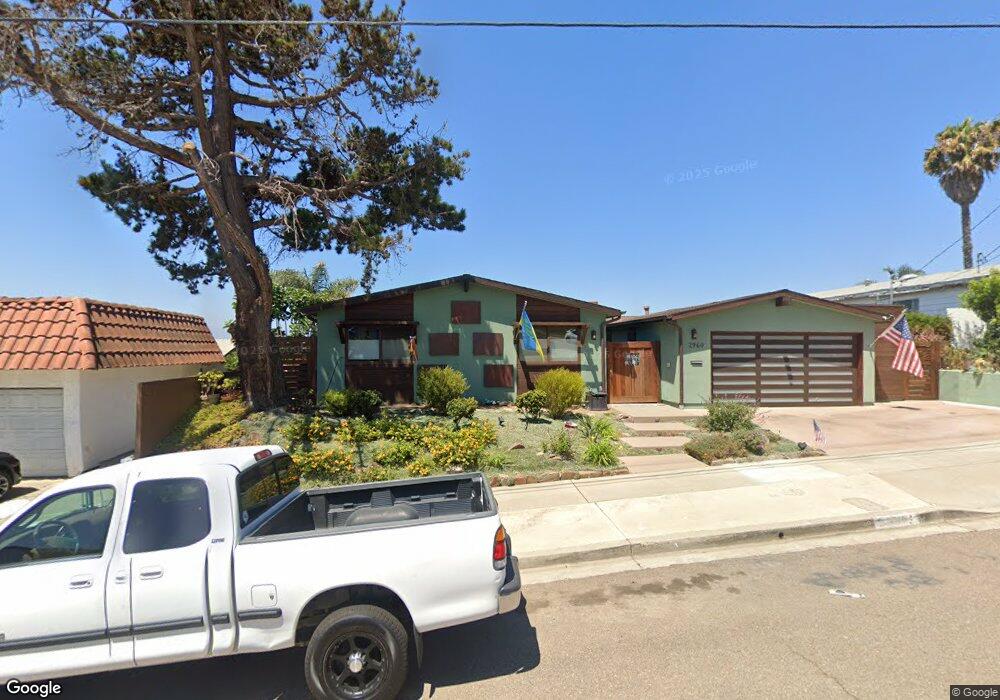
2960 Lloyd St San Diego, CA 92117
Bay Park NeighborhoodEstimated Value: $1,608,451 - $1,926,000
3
Beds
4
Baths
1,922
Sq Ft
$892/Sq Ft
Est. Value
About This Home
This home is located at 2960 Lloyd St, San Diego, CA 92117 and is currently estimated at $1,715,113, approximately $892 per square foot. 2960 Lloyd St is a home located in San Diego County with nearby schools including Toler Elementary School, Marston Middle School, and Clairemont High School.
Ownership History
Date
Name
Owned For
Owner Type
Purchase Details
Closed on
Nov 4, 2021
Sold by
Adams Kathleen and Adams Gregory
Bought by
Adams Gregory S and Adams Kathleen A
Current Estimated Value
Purchase Details
Closed on
Aug 6, 2012
Sold by
Adams Gregory and Adams Kathleen
Bought by
Adams Kathleen and Adams Gregory
Home Financials for this Owner
Home Financials are based on the most recent Mortgage that was taken out on this home.
Original Mortgage
$451,300
Interest Rate
3.49%
Mortgage Type
New Conventional
Purchase Details
Closed on
May 17, 2012
Sold by
Adams Gregory
Bought by
Adams Gregory and Adams Kathleen
Purchase Details
Closed on
May 14, 2012
Sold by
Barnett Tamara C
Bought by
Adams Gregory
Purchase Details
Closed on
Nov 30, 2000
Sold by
Adams George T
Bought by
Adams George T and Adams Alida
Create a Home Valuation Report for This Property
The Home Valuation Report is an in-depth analysis detailing your home's value as well as a comparison with similar homes in the area
Home Values in the Area
Average Home Value in this Area
Purchase History
| Date | Buyer | Sale Price | Title Company |
|---|---|---|---|
| Adams Gregory S | -- | None Available | |
| Adams Kathleen | -- | First American Title Company | |
| Adams Gregory | -- | None Available | |
| Adams Gregory | -- | None Available | |
| Adams George T | -- | -- |
Source: Public Records
Mortgage History
| Date | Status | Borrower | Loan Amount |
|---|---|---|---|
| Closed | Adams Kathleen | $451,300 |
Source: Public Records
Tax History Compared to Growth
Tax History
| Year | Tax Paid | Tax Assessment Tax Assessment Total Assessment is a certain percentage of the fair market value that is determined by local assessors to be the total taxable value of land and additions on the property. | Land | Improvement |
|---|---|---|---|---|
| 2025 | $3,652 | $307,549 | $44,092 | $263,457 |
| 2024 | $3,652 | $301,520 | $43,228 | $258,292 |
| 2023 | $3,569 | $295,609 | $42,381 | $253,228 |
| 2022 | $3,473 | $289,813 | $41,550 | $248,263 |
| 2021 | $3,448 | $284,132 | $40,736 | $243,396 |
| 2020 | $3,405 | $281,220 | $40,319 | $240,901 |
| 2019 | $3,343 | $275,707 | $39,529 | $236,178 |
| 2018 | $3,142 | $270,302 | $38,754 | $231,548 |
| 2017 | $3,131 | $265,003 | $37,995 | $227,008 |
| 2016 | $3,080 | $259,807 | $37,250 | $222,557 |
| 2015 | $3,035 | $255,905 | $36,691 | $219,214 |
| 2014 | $2,988 | $250,893 | $35,973 | $214,920 |
Source: Public Records
Map
Nearby Homes
- 2916 Chicago St
- 2841 Lloyd St
- 3212 Donley St
- 2514 Clairemont Dr Unit 306
- 2510 Clairemont Dr Unit 303
- 2540 Clairemont Dr Unit 202
- 2530 Clairemont Dr Unit 107
- 2540 Clairemont Dr Unit 307
- 2727 Morena Blvd Unit 309
- 3154 Lloyd St
- 2910 Erie St
- 3226 Lloyd St
- 2949 Erie St
- 2630 Erie St Unit 16
- 4603 Huron Ave
- 2812 Hartford Ct
- 3115 Geronimo Ave
- 4732 Iroquois Ave Unit S
- 4850 Field St
- 4407 Dakota Dr