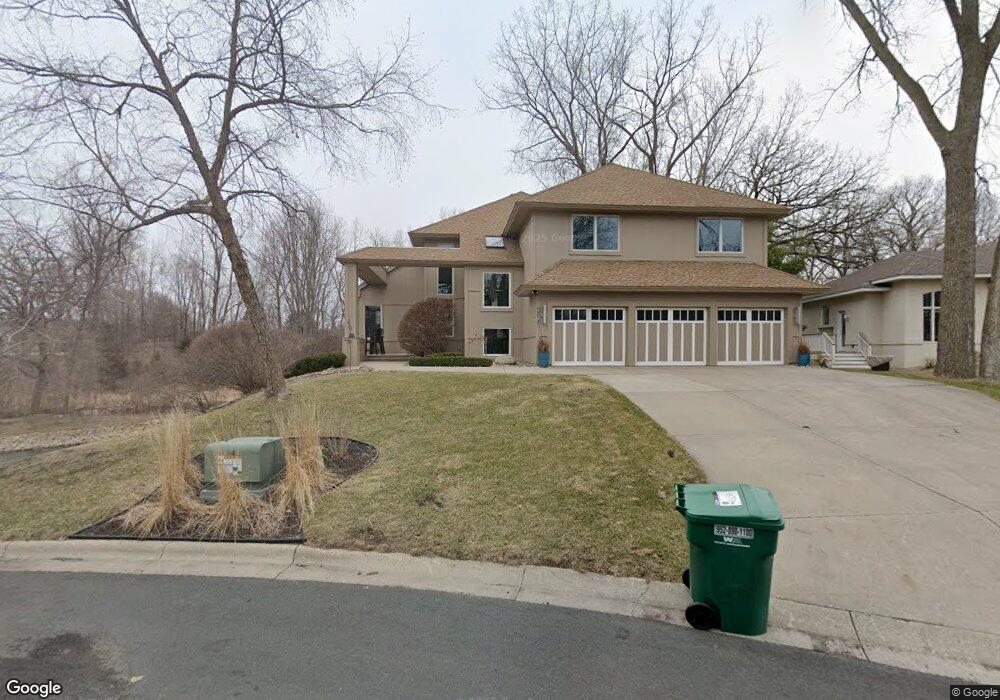
2961 Cedar Crossing Hopkins, MN 55305
Estimated Value: $817,000 - $1,066,000
4
Beds
4
Baths
4,447
Sq Ft
$220/Sq Ft
Est. Value
About This Home
This home is located at 2961 Cedar Crossing, Hopkins, MN 55305 and is currently estimated at $979,178, approximately $220 per square foot. 2961 Cedar Crossing is a home located in Hennepin County with nearby schools including L.H. Tanglen Elementary School, Hopkins North Junior High School, and Hopkins Senior High School.
Ownership History
Date
Name
Owned For
Owner Type
Purchase Details
Closed on
Jul 16, 2019
Sold by
Allen Jeffrey D and Allen Kimberly S
Bought by
Korbel Bryce
Current Estimated Value
Home Financials for this Owner
Home Financials are based on the most recent Mortgage that was taken out on this home.
Original Mortgage
$484,350
Outstanding Balance
$433,332
Interest Rate
4.91%
Mortgage Type
Adjustable Rate Mortgage/ARM
Estimated Equity
$545,846
Purchase Details
Closed on
Apr 27, 2018
Sold by
Lehman Harlan Anthony and Burton Deanna
Bought by
Allen Jeffrey D and Allen Kimberly S
Home Financials for this Owner
Home Financials are based on the most recent Mortgage that was taken out on this home.
Original Mortgage
$194,000
Interest Rate
4.45%
Mortgage Type
New Conventional
Purchase Details
Closed on
Sep 6, 2012
Sold by
Lehman Lainie Hymanson
Bought by
Lehman Harlan Anthony
Purchase Details
Closed on
Jul 16, 1996
Sold by
Halley'S Custom
Bought by
Lehman Harlan and Lehman Lainie
Create a Home Valuation Report for This Property
The Home Valuation Report is an in-depth analysis detailing your home's value as well as a comparison with similar homes in the area
Home Values in the Area
Average Home Value in this Area
Purchase History
| Date | Buyer | Sale Price | Title Company |
|---|---|---|---|
| Korbel Bryce | $830,000 | Burnet Title | |
| Allen Jeffrey D | $744,000 | Burnet Title | |
| Lehman Harlan Anthony | -- | None Available | |
| Lehman Harlan | $110,000 | -- |
Source: Public Records
Mortgage History
| Date | Status | Borrower | Loan Amount |
|---|---|---|---|
| Open | Korbel Bryce | $484,350 | |
| Previous Owner | Allen Jeffrey D | $194,000 |
Source: Public Records
Tax History Compared to Growth
Tax History
| Year | Tax Paid | Tax Assessment Tax Assessment Total Assessment is a certain percentage of the fair market value that is determined by local assessors to be the total taxable value of land and additions on the property. | Land | Improvement |
|---|---|---|---|---|
| 2024 | $12,507 | $926,300 | $208,400 | $717,900 |
| 2023 | $12,027 | $924,100 | $208,400 | $715,700 |
| 2022 | $10,393 | $898,300 | $208,400 | $689,900 |
| 2021 | $10,186 | $766,700 | $179,000 | $587,700 |
| 2020 | $8,688 | $761,400 | $179,000 | $582,400 |
| 2019 | $7,607 | $633,000 | $179,000 | $454,000 |
| 2018 | $7,898 | $569,500 | $179,000 | $390,500 |
| 2017 | $7,163 | $519,200 | $145,000 | $374,200 |
| 2016 | $7,377 | $519,200 | $145,000 | $374,200 |
| 2015 | $6,948 | $481,500 | $100,000 | $381,500 |
| 2014 | -- | $439,800 | $100,000 | $339,800 |
Source: Public Records
Map
Nearby Homes
- 11643 Foxhall Rd
- 11984 Saint Albans Hollow Dr
- 3056 Saint Albans Hollow Cir
- 3000 Saint Albans Mill Rd Unit 109
- 3030 Saint Albans Mill Rd Unit 115
- 3020 Saint Albans Mill Rd Unit 106
- 3020 Saint Albans Mill Rd Unit 312
- 11886 Tapestry Ln
- 15 Saint Albans Rd E
- 3520 Fairway Ln
- 10 Saint Albans Rd E
- 10511 Cedar Lake Rd Unit 520
- 2890 Ella Ln
- 10451 Greenbrier Rd Unit 115
- 10451 Greenbrier Rd Unit 316
- 10441 Greenbrier Rd Unit 315
- 2711 Bent Tree Cir
- 10501 Cedar Lake Rd Unit 414
- 10501 Cedar Lake Rd Unit 512
- 10501 Cedar Lake Rd Unit 420
- 2973 Cedar Crossing
- 3001 Cedar Crossing
- 2997 Cedar Crossing
- 2985 Cedar Crossing
- 3013 Cedar Crossing
- 3012 Cedar Crossing
- 3025 Cedar Crossing
- 3036 Cedar Crossing
- 2876 Breckenridge Rd
- 3048 Cedar Crossing
- 11649 Foxhall Rd
- 11701 Cedar Lake Rd
- 11681 Foxhall Rd
- 2863 Breckenridge Rd
- 2860 Breckenridge Rd
- 11687 Foxhall Rd
- 3059 Cedar Crossing
- 11620 Foxhall Rd
- 3052 Cedar Crossing
- 2835 Breckenridge Rd