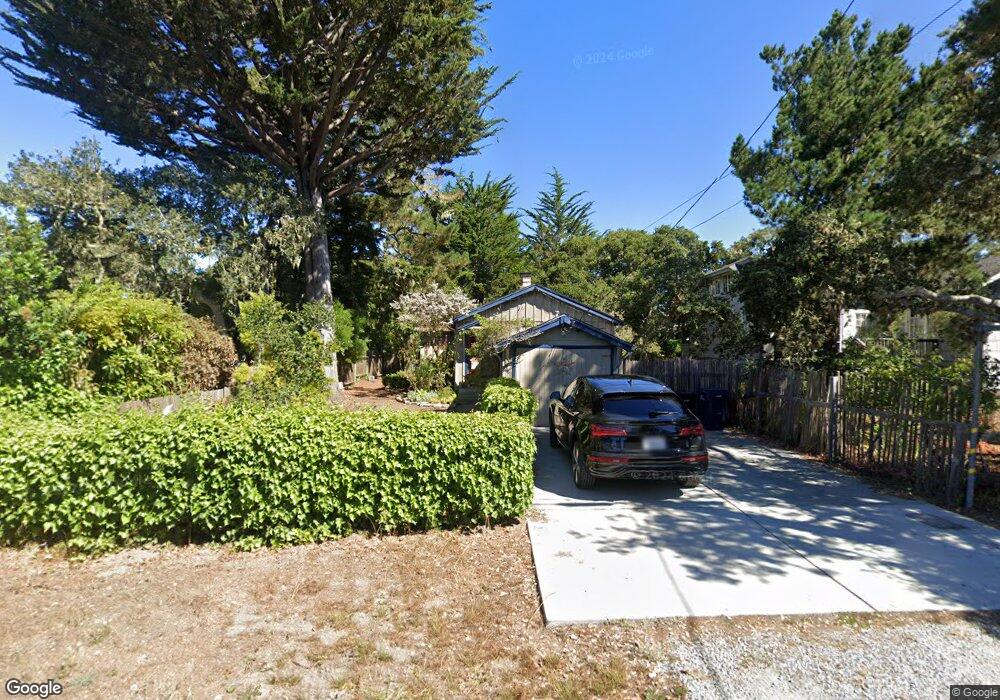
2963 Alta Ave Carmel, CA 93923
Carmel Woods NeighborhoodEstimated Value: $1,438,000 - $1,871,000
2
Beds
1
Bath
960
Sq Ft
$1,738/Sq Ft
Est. Value
About This Home
This home is located at 2963 Alta Ave, Carmel, CA 93923 and is currently estimated at $1,668,482, approximately $1,738 per square foot. 2963 Alta Ave is a home located in Monterey County with nearby schools including Carmel River Elementary School, Carmel Middle School, and Carmel High School.
Ownership History
Date
Name
Owned For
Owner Type
Purchase Details
Closed on
Apr 29, 2021
Sold by
Larson June A
Bought by
June A Larson Trust and Larson
Current Estimated Value
Purchase Details
Closed on
Feb 10, 2021
Sold by
Larson June A
Bought by
Thompson Robert
Purchase Details
Closed on
Sep 11, 2015
Sold by
Larson Casper A and Larson June A
Bought by
Larson Family Trust
Purchase Details
Closed on
Apr 27, 1998
Sold by
Larson Casper A
Bought by
Larson June A
Home Financials for this Owner
Home Financials are based on the most recent Mortgage that was taken out on this home.
Original Mortgage
$172,500
Interest Rate
4.35%
Purchase Details
Closed on
Apr 20, 1998
Sold by
Carlon Letha B and Letha B Carlon Family Trust
Bought by
Larson June A
Home Financials for this Owner
Home Financials are based on the most recent Mortgage that was taken out on this home.
Original Mortgage
$172,500
Interest Rate
4.35%
Create a Home Valuation Report for This Property
The Home Valuation Report is an in-depth analysis detailing your home's value as well as a comparison with similar homes in the area
Home Values in the Area
Average Home Value in this Area
Purchase History
| Date | Buyer | Sale Price | Title Company |
|---|---|---|---|
| June A Larson Trust | -- | None Listed On Document | |
| Thompson Robert | -- | None Available | |
| Larson June A | -- | None Available | |
| Larson Family Trust | -- | None Available | |
| Larson June A | -- | Old Republic Title Company | |
| Larson June A | $350,000 | Old Republic Title Company |
Source: Public Records
Mortgage History
| Date | Status | Borrower | Loan Amount |
|---|---|---|---|
| Previous Owner | Larson June A | $172,500 |
Source: Public Records
Tax History Compared to Growth
Tax History
| Year | Tax Paid | Tax Assessment Tax Assessment Total Assessment is a certain percentage of the fair market value that is determined by local assessors to be the total taxable value of land and additions on the property. | Land | Improvement |
|---|---|---|---|---|
| 2025 | $6,669 | $558,829 | $439,089 | $119,740 |
| 2024 | $6,669 | $547,873 | $430,480 | $117,393 |
| 2023 | $6,678 | $537,132 | $422,040 | $115,092 |
| 2022 | $6,544 | $526,601 | $413,765 | $112,836 |
| 2021 | $6,361 | $516,276 | $405,652 | $110,624 |
| 2020 | $6,220 | $510,983 | $401,493 | $109,490 |
| 2019 | $6,092 | $500,965 | $393,621 | $107,344 |
| 2018 | $5,938 | $491,143 | $385,903 | $105,240 |
| 2017 | $5,768 | $481,514 | $378,337 | $103,177 |
| 2016 | $5,632 | $472,073 | $370,919 | $101,154 |
| 2015 | $5,491 | $464,983 | $365,348 | $99,635 |
| 2014 | $5,380 | $455,876 | $358,192 | $97,684 |
Source: Public Records
Map
Nearby Homes
- 24694 Dolores St
- 24587 Castro Ln
- 24703 Camino Del Monte
- 24424 San Juan Rd
- 24429 Portola Ave
- 3 Lincoln St
- 24805 Lower Trail
- 4 Guadalupe St
- 24308 San Juan Rd
- 0 Casanova 3 Se of 4th St Unit ML82019658
- 3380 San Luis Ave
- 24751 Crestview Cir
- 8&9 Palou Nw of Casanova
- 24501 Via Mar Monte Unit 48
- 0 NE Corner San Carlos & 8th Unit 1
- 0 Carpenter & 2nd Corner NW Unit ML82002239
- 3600 High Meadow Dr Unit 9
- 2 San Antonio Ave
- 3600 Via Mar Monte
- 1634 Sonado Rd
- 2935 Alta Ave
- 2969 Alta Ave
- 2947 Alta Ave
- 0 Alta Ave Unit ML80509199
- 0 Alta Ave Unit ML80957142
- 24687 Dolores St
- 2951 Alta Ave
- 24683 Dolores St
- 24691 Dolores St
- 2985 Alta Ave
- 24695 Dolores St
- 2931 Alta Ave
- 24675 Dolores St
- 24699 Dolores St
- 24711 Dolores St
- 24711 Dolores St
- 24671 Dolores St
- 2923 Alta Ave
- 3001 Alta Ave
- 0 Mission St Unit 3N ML81428781