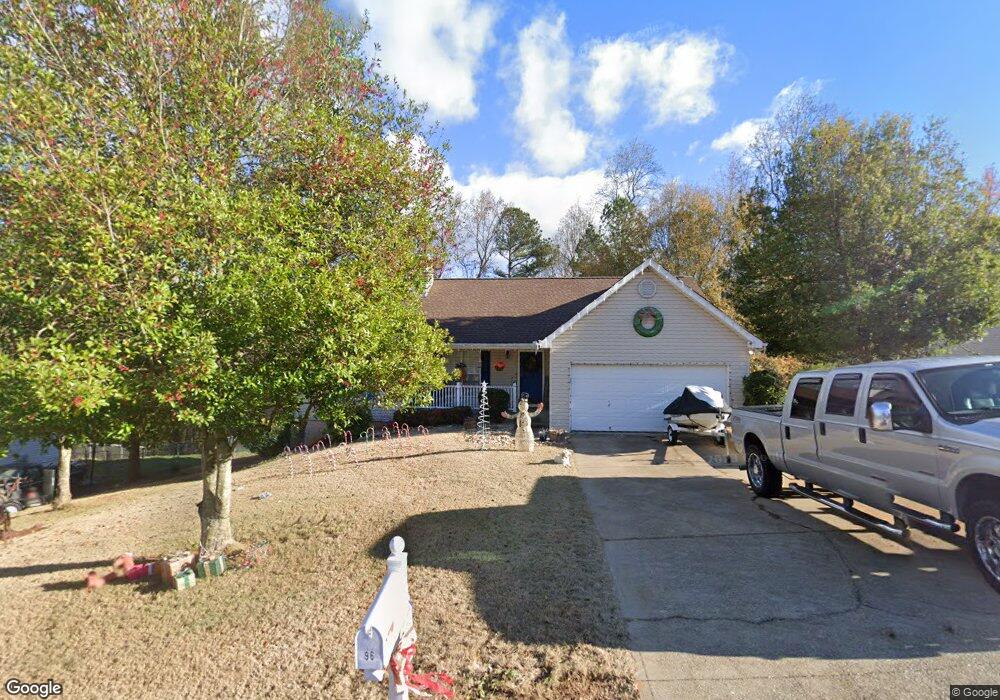
2963 Horseshoe Bend Gainesville, GA 30507
Estimated Value: $277,000 - $336,000
3
Beds
2
Baths
1,352
Sq Ft
$229/Sq Ft
Est. Value
About This Home
This home is located at 2963 Horseshoe Bend, Gainesville, GA 30507 and is currently estimated at $309,087, approximately $228 per square foot. 2963 Horseshoe Bend is a home located in Hall County with nearby schools including Tadmore Elementary School, East Hall Middle School, and East Hall High School.
Ownership History
Date
Name
Owned For
Owner Type
Purchase Details
Closed on
Feb 9, 2009
Sold by
Haney Fayth K and Haney Etal
Bought by
Nicholson Christopher L
Current Estimated Value
Purchase Details
Closed on
May 31, 2007
Sold by
Nicholson Chris L and Nicholson Gina
Bought by
Nicholson Chris L
Purchase Details
Closed on
Jan 20, 2000
Sold by
Haney Fayth K
Bought by
Nicholson Chris L
Home Financials for this Owner
Home Financials are based on the most recent Mortgage that was taken out on this home.
Original Mortgage
$111,400
Interest Rate
7.8%
Mortgage Type
FHA
Purchase Details
Closed on
Dec 28, 1999
Sold by
Sunrise Home Builders Inc
Bought by
Nicholson Gina
Home Financials for this Owner
Home Financials are based on the most recent Mortgage that was taken out on this home.
Original Mortgage
$111,400
Interest Rate
7.8%
Mortgage Type
FHA
Purchase Details
Closed on
Dec 2, 1998
Sold by
Whitmire Tim
Bought by
Sunrise Home Builders Inc
Create a Home Valuation Report for This Property
The Home Valuation Report is an in-depth analysis detailing your home's value as well as a comparison with similar homes in the area
Home Values in the Area
Average Home Value in this Area
Purchase History
| Date | Buyer | Sale Price | Title Company |
|---|---|---|---|
| Nicholson Christopher L | -- | -- | |
| Nicholson Chris L | -- | -- | |
| Nicholson Chris L | -- | -- | |
| Nicholson Gina | $112,100 | -- | |
| Sunrise Home Builders Inc | $350,000 | -- |
Source: Public Records
Mortgage History
| Date | Status | Borrower | Loan Amount |
|---|---|---|---|
| Previous Owner | Nicholson Gina | $111,400 |
Source: Public Records
Tax History Compared to Growth
Tax History
| Year | Tax Paid | Tax Assessment Tax Assessment Total Assessment is a certain percentage of the fair market value that is determined by local assessors to be the total taxable value of land and additions on the property. | Land | Improvement |
|---|---|---|---|---|
| 2024 | $2,979 | $117,360 | $20,800 | $96,560 |
| 2023 | $2,154 | $99,600 | $7,360 | $92,240 |
| 2022 | $2,191 | $81,960 | $7,360 | $74,600 |
| 2021 | $1,919 | $70,080 | $7,360 | $62,720 |
| 2020 | $1,894 | $67,240 | $7,360 | $59,880 |
| 2019 | $1,928 | $67,920 | $7,360 | $60,560 |
| 2018 | $1,785 | $60,720 | $7,360 | $53,360 |
| 2017 | $1,369 | $50,360 | $7,360 | $43,000 |
Source: Public Records
Map
Nearby Homes
- 3044 Saddle Creek Dr
- 3119 Gillsville Hwy
- 2916 Maverick Trail
- 2967 Maverick Trail
- 3368 Green Leaf Ln
- 3457 Silver Chase Ct
- 3313 Rose Petal St
- 3285 Rose Petal St
- 2860 Jack Bryant Cir
- 2942 Salinger Way
- 3271 Heatherwood Dr
- 3114 Heritage Glen Dr
- 3520 Silver Mist Cir
- 3501 Silver Wood Walk
- 3016 Orwell Dr
- 2857 Bullfrog Lane Lot 171
- 2664
- 2660 Lotus Landing Lot 36
- 2959 Horseshoe Bend
- 2967 Horseshoe Bend
- 2958 Horseshoe Bend
- 2956 Horseshoe Bend
- 2962 Horseshoe Bend
- 2971 Horseshoe Bend
- 2955 Horseshoe Bend
- 2966 Horseshoe Bend
- 2954 Horseshoe Bend
- 2951 Horseshoe Bend
- 0 Bridle Ct Unit 7414850
- 0 Bridle Ct Unit 8303162
- 0 Bridle Ct Unit 3048041
- 0 Bridle Ct
- 2970 Horseshoe Bend
- 2975 Horseshoe Bend
- 2943 Bridle Ct
- 2974 Horseshoe Bend
- 3023 Saddle Creek Dr
- 2983 Horseshoe Bend