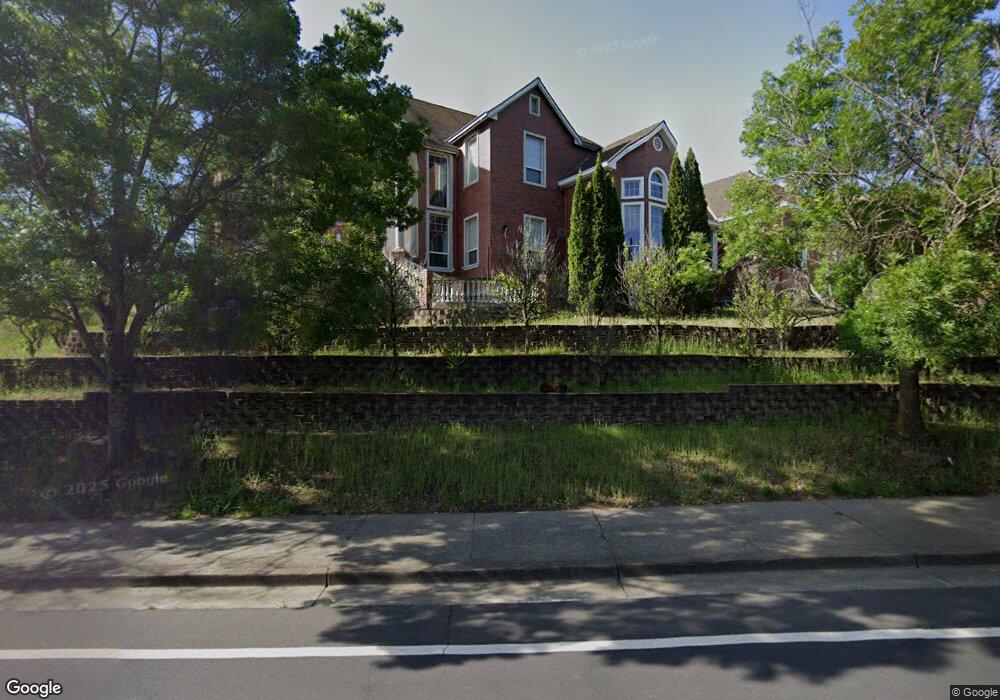
2963 Waterman Blvd Fairfield, CA 94534
Estimated Value: $743,000 - $874,000
4
Beds
3
Baths
3,034
Sq Ft
$269/Sq Ft
Est. Value
About This Home
This home is located at 2963 Waterman Blvd, Fairfield, CA 94534 and is currently estimated at $817,517, approximately $269 per square foot. 2963 Waterman Blvd is a home located in Solano County with nearby schools including K. I. Jones Elementary School, Angelo Rodriguez High School, and Solano Christian Academy.
Ownership History
Date
Name
Owned For
Owner Type
Purchase Details
Closed on
Dec 1, 2008
Sold by
Behari Shiri
Bought by
Behari Vimia W
Current Estimated Value
Home Financials for this Owner
Home Financials are based on the most recent Mortgage that was taken out on this home.
Original Mortgage
$240,000
Interest Rate
6.04%
Mortgage Type
Purchase Money Mortgage
Purchase Details
Closed on
Nov 26, 2008
Sold by
Behari Ravinesh Tony and Behari Reshma
Bought by
Behari Vimla
Home Financials for this Owner
Home Financials are based on the most recent Mortgage that was taken out on this home.
Original Mortgage
$240,000
Interest Rate
6.04%
Mortgage Type
Purchase Money Mortgage
Purchase Details
Closed on
Oct 11, 2008
Sold by
Gusenkov Nikolay and Gusenkov Valentina
Bought by
Shon Te East A and Walks With Spirit
Home Financials for this Owner
Home Financials are based on the most recent Mortgage that was taken out on this home.
Original Mortgage
$240,000
Interest Rate
6.04%
Mortgage Type
Purchase Money Mortgage
Create a Home Valuation Report for This Property
The Home Valuation Report is an in-depth analysis detailing your home's value as well as a comparison with similar homes in the area
Home Values in the Area
Average Home Value in this Area
Purchase History
| Date | Buyer | Sale Price | Title Company |
|---|---|---|---|
| Behari Vimia W | -- | Fidelity National Title Co | |
| Behari Vimla | $300,000 | Fidelity National Title Co | |
| Shon Te East A | $84,000 | None Available |
Source: Public Records
Mortgage History
| Date | Status | Borrower | Loan Amount |
|---|---|---|---|
| Closed | Behari Vimla | $240,000 |
Source: Public Records
Tax History Compared to Growth
Tax History
| Year | Tax Paid | Tax Assessment Tax Assessment Total Assessment is a certain percentage of the fair market value that is determined by local assessors to be the total taxable value of land and additions on the property. | Land | Improvement |
|---|---|---|---|---|
| 2025 | $8,010 | $682,506 | $225,354 | $457,152 |
| 2024 | $8,010 | $669,125 | $220,936 | $448,189 |
| 2023 | $7,776 | $656,005 | $216,604 | $439,401 |
| 2022 | $7,777 | $643,143 | $212,357 | $430,786 |
| 2021 | $7,705 | $630,534 | $208,194 | $422,340 |
| 2020 | $7,930 | $624,070 | $206,060 | $418,010 |
| 2019 | $7,756 | $611,834 | $202,020 | $409,814 |
| 2018 | $7,979 | $599,838 | $198,059 | $401,779 |
| 2017 | $7,923 | $588,077 | $194,176 | $393,901 |
| 2016 | $7,881 | $576,547 | $190,369 | $386,178 |
| 2015 | $7,433 | $567,888 | $187,510 | $380,378 |
| 2014 | $7,376 | $556,764 | $183,837 | $372,927 |
Source: Public Records
Map
Nearby Homes
- 3033 Vista Grande
- 3114 Lomita Ct
- 2125 Mecca Ct
- 1737 Kearny Ct
- 1986 Larchmont Cir
- 2846 Owens St
- 3109 Burbank Dr
- 2796 Mankas Blvd
- 3451 Nantucket Dr
- 2695 Vista Linda
- 2045 Dorland Dr
- 3418 Astoria Ct
- 2724 Toland Dr
- 2517 Kingsmill Ln
- 2051 Barbour Dr
- 2635 Alvarado Ct Unit 3
- 2516 Bellevue Ct
- 1737 Alford Dr
- 124 Cannes Ct
- 2474 Bay Hill Cir
- 2969 Waterman Blvd
- 2957 Waterman Blvd
- 2105 Madrone Ct
- 2102 Madrone Ct
- 3092 Orchard View Ct
- 3034 Vista Grande
- 3027 Vista Grande
- 3086 Orchard View Ct
- 3080 Orchard View Ct
- 3098 Orchard View Ct
- 2103 Madrone Ct
- 3028 Vista Grande
- 3074 Orchard View Ct
- 3021 Vista Grande
- 2117 Madrone Ct
- 3104 Orchard View Dr
- 3022 Vista Grande None
- 2114 Madrone Ct
- 2957 Calaveras Dr