Estimated Value: $768,000 - $861,000
4
Beds
4
Baths
2,888
Sq Ft
$281/Sq Ft
Est. Value
About This Home
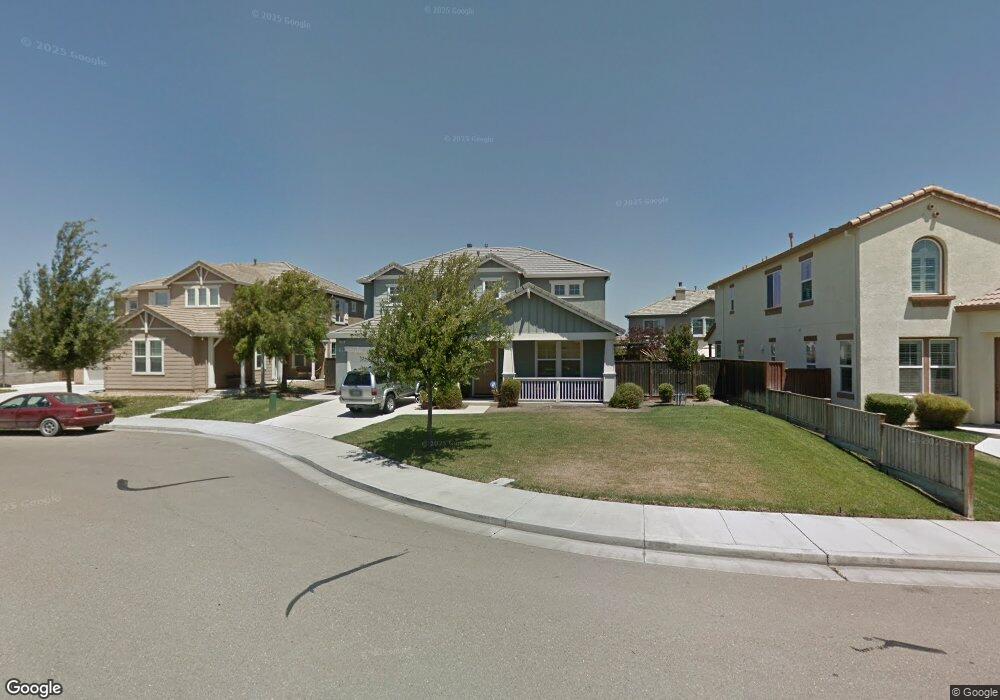
This home is located at 2965 Lyon Ct Unit 2B, Tracy, CA 95377 and is currently estimated at $812,183, approximately $281 per square foot. 2965 Lyon Ct Unit 2B is a home located in San Joaquin County with nearby schools including George Kelly Elementary School, John C. Kimball High School, and Tracy Independent Study Charter School.
Ownership History
Date
Name
Owned For
Owner Type
Purchase Details
Closed on
Jun 15, 2020
Sold by
Dulay Marlo Johan and Dulay Jerome M
Bought by
Dulay Mario Johan and Dulay Blanca Lampitoc
Current Estimated Value
Home Financials for this Owner
Home Financials are based on the most recent Mortgage that was taken out on this home.
Original Mortgage
$343,800
Outstanding Balance
$304,752
Interest Rate
3.2%
Mortgage Type
New Conventional
Estimated Equity
$507,431
Purchase Details
Closed on
Sep 30, 2003
Sold by
Dulay Ofelia A
Bought by
Dulay Jerome
Purchase Details
Closed on
Jul 11, 2003
Sold by
Standard Pacific Corp
Bought by
Dulay Marlo Johan and Dulay Jerome M
Home Financials for this Owner
Home Financials are based on the most recent Mortgage that was taken out on this home.
Original Mortgage
$322,700
Interest Rate
5%
Mortgage Type
Purchase Money Mortgage
Create a Home Valuation Report for This Property
The Home Valuation Report is an in-depth analysis detailing your home's value as well as a comparison with similar homes in the area
Home Values in the Area
Average Home Value in this Area
Purchase History
| Date | Buyer | Sale Price | Title Company |
|---|---|---|---|
| Dulay Mario Johan | -- | Title365 | |
| Dulay Jerome | -- | First Amer Title Co | |
| Dulay Marlo Johan | $434,500 | First Amer Title Co |
Source: Public Records
Mortgage History
| Date | Status | Borrower | Loan Amount |
|---|---|---|---|
| Open | Dulay Mario Johan | $343,800 | |
| Previous Owner | Dulay Marlo Johan | $322,700 | |
| Closed | Dulay Marlo Johan | $68,100 |
Source: Public Records
Tax History
| Year | Tax Paid | Tax Assessment Tax Assessment Total Assessment is a certain percentage of the fair market value that is determined by local assessors to be the total taxable value of land and additions on the property. | Land | Improvement |
|---|---|---|---|---|
| 2025 | $9,755 | $624,317 | $187,103 | $437,214 |
| 2024 | $9,071 | $605,281 | $181,198 | $424,083 |
| 2023 | $8,903 | $593,414 | $177,646 | $415,768 |
| 2022 | $8,718 | $581,779 | $174,163 | $407,616 |
| 2021 | $8,596 | $570,373 | $170,749 | $399,624 |
| 2020 | $8,504 | $564,526 | $168,999 | $395,527 |
| 2019 | $9,742 | $553,458 | $165,686 | $387,772 |
| 2018 | $9,566 | $542,607 | $162,438 | $380,169 |
| 2017 | $7,781 | $526,000 | $157,000 | $369,000 |
| 2016 | $7,745 | $516,000 | $154,000 | $362,000 |
| 2014 | $6,949 | $460,000 | $138,000 | $322,000 |
Source: Public Records
Map
Nearby Homes
- 2921 Compton Place
- 2689 Jackson Ave
- 481 Keys Ct
- 1214 Dover Ln
- 1294 Dover Ln
- 2431 Garrett Ct
- 1385 Lankershire Dr
- 2432 Tennis Ln
- 538 New Haven Dr
- 2902 Campbell Ln
- 2325 Alamo Ct
- 2488 Gaines Ln
- 2219 Yellowstone Ave
- 1572 Cole Ln
- 2919 Kennsington Ln
- 3030 W Byron Rd
- 2431 Ogden Sannazor Ct
- 573 Veneto Ct
- 1233 Plaza Ct
- 2132 Tennis Ln
- 2955 Lyon Ct Unit 2B
- 2975 Lyon Ct Unit 2B
- 2956 Young Ct
- 2966 Young Ct
- 2945 Lyon Ct
- 2946 Young Ct
- 2964 Lyon Ct
- 2976 Young Ct
- 2935 Lyon Ct
- 2954 Lyon Ct
- 2974 Lyon Ct Unit 2B
- 2936 Young Ct
- 2944 Lyon Ct Unit 2B
- 2925 Lyon Ct
- 2986 Young Ct Unit 2A
- 2934 Lyon Ct
- 2926 Young Ct
- 2987 Young Ct
- 2963 Safford Ave
- 2953 Safford Ave
Your Personal Tour Guide
Ask me questions while you tour the home.