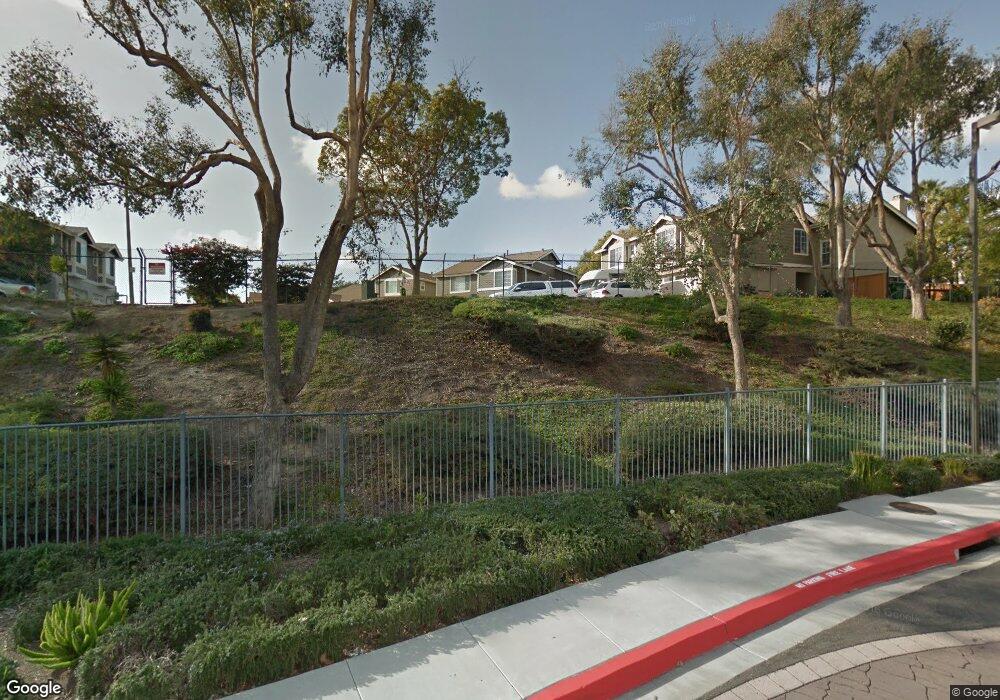
2966 Lancaster Rd Unit 2 Carlsbad, CA 92010
Calavera Hills NeighborhoodEstimated Value: $886,000 - $1,218,000
3
Beds
3
Baths
1,452
Sq Ft
$692/Sq Ft
Est. Value
About This Home
This home is located at 2966 Lancaster Rd Unit 2, Carlsbad, CA 92010 and is currently estimated at $1,005,077, approximately $692 per square foot. 2966 Lancaster Rd Unit 2 is a home located in San Diego County with nearby schools including Hope Elementary School, Calavera Hills Middle, and Sage Creek High.
Ownership History
Date
Name
Owned For
Owner Type
Purchase Details
Closed on
Feb 24, 2003
Sold by
Blahut Edward J and Blahut Bonnie J
Bought by
Blahut Ii Edward J and Blahut Bonnie J
Current Estimated Value
Home Financials for this Owner
Home Financials are based on the most recent Mortgage that was taken out on this home.
Original Mortgage
$162,000
Interest Rate
5.93%
Purchase Details
Closed on
Jan 8, 2003
Sold by
Belgum Stephen A and Belgum Lynda M
Bought by
Blahut Ii Edward J and Blahut Bonnie J
Home Financials for this Owner
Home Financials are based on the most recent Mortgage that was taken out on this home.
Original Mortgage
$162,000
Interest Rate
5.93%
Purchase Details
Closed on
Apr 16, 2002
Sold by
Belgum Stephen A
Bought by
Belgum Stephen A and Belgum Lynda M
Purchase Details
Closed on
Nov 3, 1993
Sold by
Belgum Lynda M
Bought by
Belgum Stephen A
Home Financials for this Owner
Home Financials are based on the most recent Mortgage that was taken out on this home.
Original Mortgage
$175,016
Interest Rate
6.97%
Mortgage Type
VA
Purchase Details
Closed on
Aug 19, 1991
Purchase Details
Closed on
Aug 5, 1987
Purchase Details
Closed on
Oct 13, 1986
Purchase Details
Closed on
Jun 8, 1984
Create a Home Valuation Report for This Property
The Home Valuation Report is an in-depth analysis detailing your home's value as well as a comparison with similar homes in the area
Home Values in the Area
Average Home Value in this Area
Purchase History
| Date | Buyer | Sale Price | Title Company |
|---|---|---|---|
| Blahut Ii Edward J | -- | Southland Title | |
| Blahut Ii Edward J | $297,000 | Southland Title | |
| Belgum Stephen A | -- | -- | |
| Belgum Stephen A | -- | Stewart Title Co | |
| -- | $173,000 | -- | |
| -- | $115,500 | -- | |
| -- | $100,000 | -- | |
| -- | $90,000 | -- |
Source: Public Records
Mortgage History
| Date | Status | Borrower | Loan Amount |
|---|---|---|---|
| Previous Owner | Blahut Ii Edward J | $162,000 | |
| Previous Owner | Belgum Stephen A | $175,016 |
Source: Public Records
Tax History
| Year | Tax Paid | Tax Assessment Tax Assessment Total Assessment is a certain percentage of the fair market value that is determined by local assessors to be the total taxable value of land and additions on the property. | Land | Improvement |
|---|---|---|---|---|
| 2025 | $4,526 | $429,779 | $260,694 | $169,085 |
| 2024 | $4,526 | $421,353 | $255,583 | $165,770 |
| 2023 | $4,503 | $413,092 | $250,572 | $162,520 |
| 2022 | $4,433 | $404,993 | $245,659 | $159,334 |
| 2021 | $4,400 | $397,053 | $240,843 | $156,210 |
| 2020 | $4,371 | $392,983 | $238,374 | $154,609 |
| 2019 | $4,292 | $385,278 | $233,700 | $151,578 |
| 2018 | $4,111 | $377,724 | $229,118 | $148,606 |
| 2017 | $4,043 | $370,319 | $224,626 | $145,693 |
| 2016 | $3,880 | $363,059 | $220,222 | $142,837 |
| 2015 | $3,864 | $357,607 | $216,915 | $140,692 |
| 2014 | $3,801 | $350,603 | $212,666 | $137,937 |
Source: Public Records
Map
Nearby Homes
- 3434 Ravine Dr
- 3652 Jetty Point
- 2835 Hillsboro Ct
- 3522 Buck Ridge Ave
- 2823 Andover Ave
- 3505 N Fork Ave
- 3722 Bergen Peak Place
- 3593 Granite Ct
- 4375 Stanford St
- 3594 Granite Ct
- 2808 Winthrop Ave
- 2822 Winthrop Ave
- 4378 Shasta Place
- 3019 Glenbrook St
- 3712 Ridge Ct
- 3492 Corvallis St
- 4843 Nelson Ct
- 4822 Nelson Ct
- 5128 Don Mata Dr
- 5115 Don Miguel Dr Unit 165
- 2964 Lancaster Rd
- 2968 Lancaster Rd
- 2962 Lancaster Rd
- 2970 Lancaster Rd
- 2958 Lancaster Rd
- 2991 Lexington Cir
- 2993 Lexington Cir
- 2985 Lexington Cir
- 2995 Lexington Cir
- 2983 Lexington Cir
- 2956 Lancaster Rd
- 2997 Lexington Cir
- 2981 Lexington Cir
- 2954 Lancaster Rd
- 2965 Lancaster Rd
- 2979 Lexington Cir
- 2967 Lancaster Rd
- 2961 Lancaster Rd
- 2977 Lexington Cir
- 2952 Lancaster Rd
Your Personal Tour Guide
Ask me questions while you tour the home.