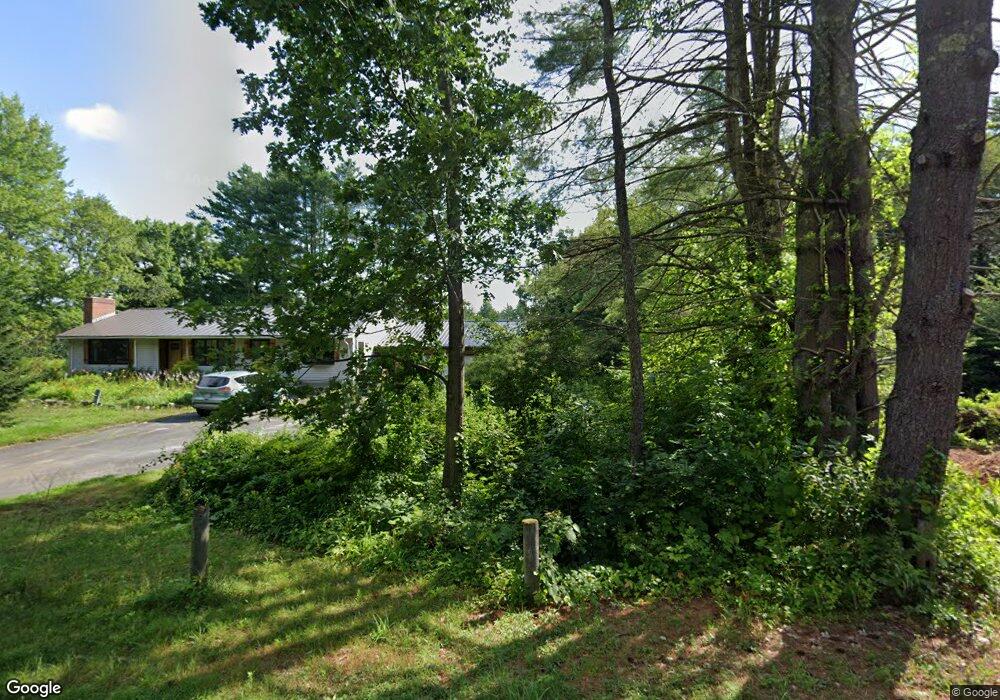
2966 Shelburne Falls Rd Conway, MA 01341
Estimated Value: $429,582 - $445,000
3
Beds
1
Bath
1,132
Sq Ft
$385/Sq Ft
Est. Value
About This Home
This home is located at 2966 Shelburne Falls Rd, Conway, MA 01341 and is currently estimated at $435,396, approximately $384 per square foot. 2966 Shelburne Falls Rd is a home located in Franklin County with nearby schools including Frontier Regional School.
Ownership History
Date
Name
Owned For
Owner Type
Purchase Details
Closed on
Jan 9, 2015
Sold by
Siano John A and Siano Maura
Bought by
Sinkus Jeremy C
Current Estimated Value
Home Financials for this Owner
Home Financials are based on the most recent Mortgage that was taken out on this home.
Original Mortgage
$175,000
Outstanding Balance
$129,764
Interest Rate
3%
Mortgage Type
Adjustable Rate Mortgage/ARM
Estimated Equity
$305,632
Purchase Details
Closed on
Feb 6, 2007
Sold by
Peltier Irt and Peltier Sally A
Bought by
Siano John A
Home Financials for this Owner
Home Financials are based on the most recent Mortgage that was taken out on this home.
Original Mortgage
$200,000
Interest Rate
6.16%
Mortgage Type
Purchase Money Mortgage
Purchase Details
Closed on
Aug 31, 2006
Sold by
Bishop Richard C
Bought by
Peltier Irt and Peltier Sally A
Purchase Details
Closed on
Jun 8, 2004
Sold by
Peltier Donald B and Peltier Sally A
Bought by
Peltier Irt and Peltier Donald B
Create a Home Valuation Report for This Property
The Home Valuation Report is an in-depth analysis detailing your home's value as well as a comparison with similar homes in the area
Home Values in the Area
Average Home Value in this Area
Purchase History
| Date | Buyer | Sale Price | Title Company |
|---|---|---|---|
| Sinkus Jeremy C | $245,000 | -- | |
| Siano John A | $270,000 | -- | |
| Peltier Irt | -- | -- | |
| Clausen Johannes | -- | -- | |
| Peltier Irt | -- | -- |
Source: Public Records
Mortgage History
| Date | Status | Borrower | Loan Amount |
|---|---|---|---|
| Open | Sinkus Jeremy C | $175,000 | |
| Previous Owner | Siano John A | $200,000 |
Source: Public Records
Tax History
| Year | Tax Paid | Tax Assessment Tax Assessment Total Assessment is a certain percentage of the fair market value that is determined by local assessors to be the total taxable value of land and additions on the property. | Land | Improvement |
|---|---|---|---|---|
| 2025 | $5,487 | $380,000 | $101,900 | $278,100 |
| 2024 | $4,863 | $296,500 | $92,300 | $204,200 |
| 2023 | $5,085 | $296,500 | $92,300 | $204,200 |
| 2022 | $4,852 | $270,300 | $87,100 | $183,200 |
| 2021 | $4,776 | $255,000 | $82,800 | $172,200 |
| 2020 | $864 | $235,000 | $82,400 | $152,600 |
| 2019 | $4,383 | $235,000 | $82,400 | $152,600 |
| 2018 | $4,279 | $231,300 | $82,400 | $148,900 |
| 2017 | $4,106 | $231,300 | $82,400 | $148,900 |
| 2016 | $4,070 | $244,000 | $91,400 | $152,600 |
| 2015 | $3,945 | $244,000 | $91,400 | $152,600 |
Source: Public Records
Map
Nearby Homes
- 85 Dacey Rd
- lot 1 Shelburne Falls Rd
- 102 Elm St
- 10 Deerfield Ave Unit 5
- 10 Deerfield Ave Unit 2
- 143 E Buckland Rd
- 240 Beldingville Rd
- 7 Hog Hollow Rd
- 0 Upper St
- 2151 Route 2
- 2155 Massachusetts 2
- 414 Mohawk Trail
- 5 Clesson Brook Rd
- 163 S Shelburne Rd
- 527 Main St
- 32 Homestead Ave
- 23 Robbins Rd
- 130 Laurel St
- 83 Newton St
- 71 Mathews Rd
- 3014 Shelburne Falls Rd
- 3033 Shelburne Falls Rd
- 3045 Shelburne Falls Rd
- 3064 Shelburne Falls Rd
- 2848 Shelburne Falls Rd
- 3102 Shelburne Falls Rd
- 453 Hart Rd
- 3115 Shelburne Falls Rd
- 3120 Shelburne Falls Rd
- 2811 Shelburne Falls Rd
- 2790 Shelburne Falls Rd
- 101 Wilder Hill Rd
- 1049 S Shirkshire Rd
- 77 Wilder Hill Rd
- 373 Hart Rd
- 44 Wilder Hill Rd
- 25 Wilder Hill Rd
- 479 Wilder Hill Rd
- 388 Hart Rd
- 388 Hart Rd Unit 1
Your Personal Tour Guide
Ask me questions while you tour the home.