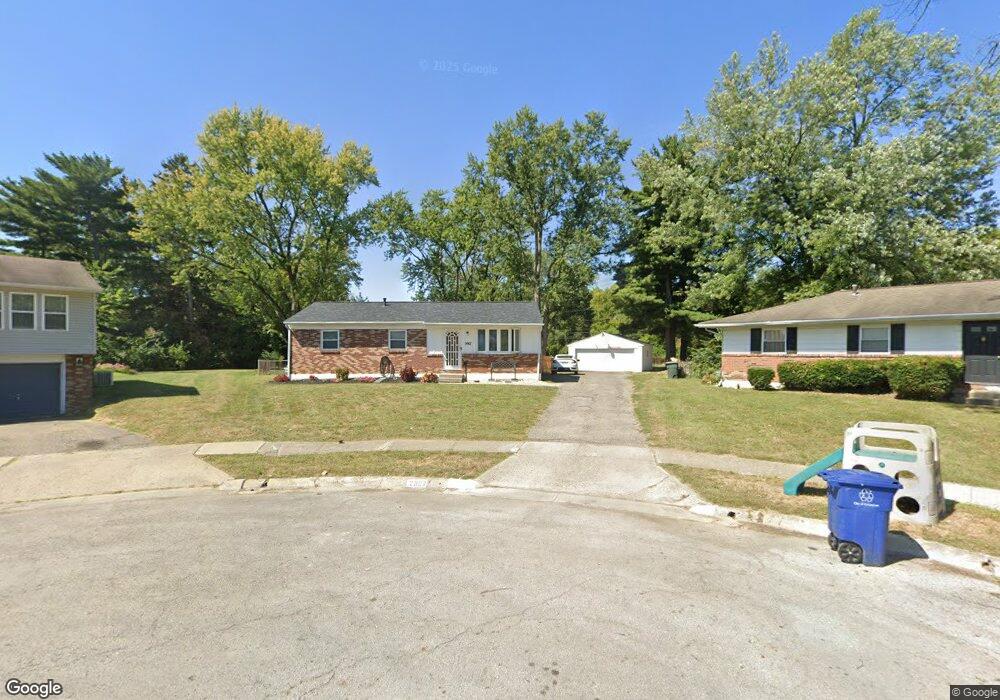
2967 Easthaven Ct N Columbus, OH 43232
Glenbrook NeighborhoodEstimated Value: $200,000 - $246,501
3
Beds
2
Baths
1,074
Sq Ft
$200/Sq Ft
Est. Value
About This Home
This home is located at 2967 Easthaven Ct N, Columbus, OH 43232 and is currently estimated at $215,125, approximately $200 per square foot. 2967 Easthaven Ct N is a home located in Franklin County with nearby schools including Easthaven Elementary School, Yorktown Middle School, and Independence High School.
Ownership History
Date
Name
Owned For
Owner Type
Purchase Details
Closed on
May 20, 1999
Sold by
Willis Theresa J and Johnson Theresa J
Bought by
Johnson Stuart A and Johnson Theresa J
Current Estimated Value
Home Financials for this Owner
Home Financials are based on the most recent Mortgage that was taken out on this home.
Original Mortgage
$67,000
Interest Rate
7.69%
Purchase Details
Closed on
Apr 5, 1990
Bought by
Willis Theresa J
Purchase Details
Closed on
Jan 22, 1990
Purchase Details
Closed on
Jul 12, 1988
Create a Home Valuation Report for This Property
The Home Valuation Report is an in-depth analysis detailing your home's value as well as a comparison with similar homes in the area
Home Values in the Area
Average Home Value in this Area
Purchase History
| Date | Buyer | Sale Price | Title Company |
|---|---|---|---|
| Johnson Stuart A | -- | -- | |
| Willis Theresa J | $69,300 | -- | |
| -- | -- | -- | |
| -- | $63,100 | -- |
Source: Public Records
Mortgage History
| Date | Status | Borrower | Loan Amount |
|---|---|---|---|
| Previous Owner | Johnson Stuart A | $67,000 |
Source: Public Records
Tax History Compared to Growth
Tax History
| Year | Tax Paid | Tax Assessment Tax Assessment Total Assessment is a certain percentage of the fair market value that is determined by local assessors to be the total taxable value of land and additions on the property. | Land | Improvement |
|---|---|---|---|---|
| 2024 | $2,639 | $58,800 | $19,110 | $39,690 |
| 2023 | $2,605 | $58,800 | $19,110 | $39,690 |
| 2022 | $1,590 | $30,660 | $8,750 | $21,910 |
| 2021 | $1,593 | $30,660 | $8,750 | $21,910 |
| 2020 | $1,595 | $30,660 | $8,750 | $21,910 |
| 2019 | $1,459 | $24,050 | $7,000 | $17,050 |
| 2018 | $1,481 | $24,050 | $7,000 | $17,050 |
| 2017 | $1,558 | $24,050 | $7,000 | $17,050 |
| 2016 | $1,658 | $25,030 | $6,300 | $18,730 |
| 2015 | $1,505 | $25,030 | $6,300 | $18,730 |
| 2014 | $1,509 | $25,030 | $6,300 | $18,730 |
| 2013 | $783 | $26,320 | $6,615 | $19,705 |
Source: Public Records
Map
Nearby Homes
- 3038 Wadsworth Ct
- 3036 Wadsworth Ct
- 3054 Wadsworth Ct
- 0 Ravenswood Ct
- 2971 Queensrowe Dr
- 1782 Newfield Rd
- 2840 Manola Dr
- 1710 Kenwick Rd
- 1677 Kenview Rd
- 1637 S James Rd
- 2252 Meridian Ct
- 2639 Halleck Dr
- 2468 Natchez Dr Unit D
- 2894 Landon Dr
- 3031 Janwood Dr
- 2275 Cardston Ct
- 3246 E Deshler Ave
- 3365 Bruceton Ave
- 1624 Miltwood Rd
- 2664 Sonata Dr
- 2973 Easthaven Ct N
- 2965 Easthaven Ct N
- 2979 Easthaven Ct N
- 2942 Arrowhead Ct
- 2970 Easthaven Ct N
- 2978 Easthaven Ct N
- 2950 Arrowhead Ct
- 2985 Easthaven Ct N
- 2974 Easthaven Ct N
- 2934 Arrowhead Ct
- 2105 Easthaven Dr
- 2091 Easthaven Dr
- 2958 Arrowhead Ct
- 2087 Easthaven Dr
- 2931 Arrowhead Ct
- 2085 Easthaven Dr
- 2083 Easthaven Dr
- 2991 Easthaven Ct S
- 2947 Arrowhead Ct
- 2990 Easthaven Ct S