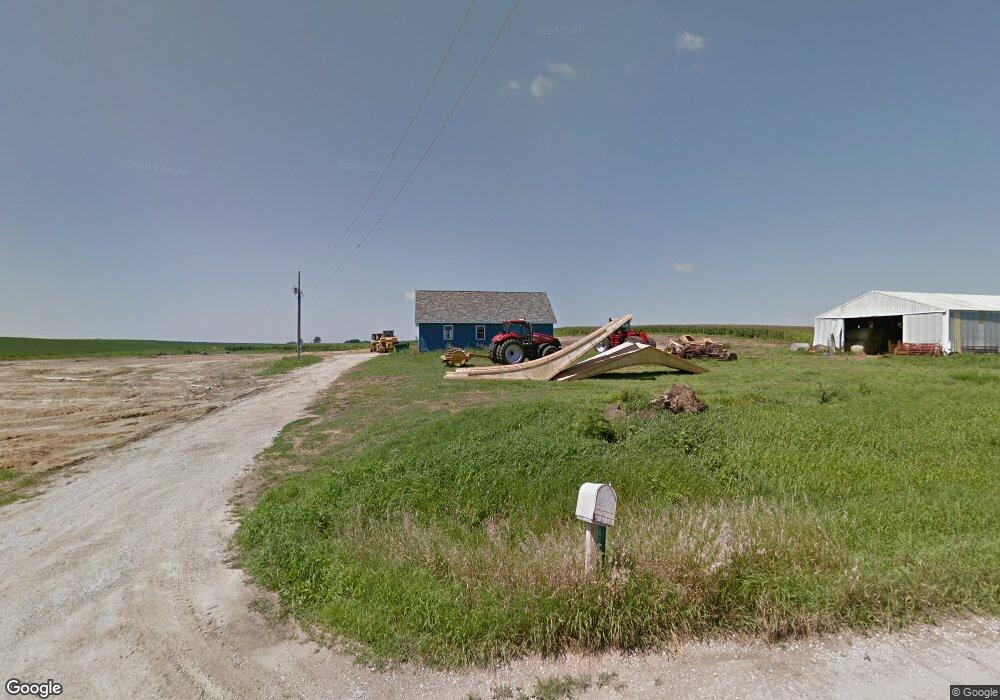
2967 Iowa Ave Rowley, IA 52329
Estimated Value: $197,000 - $482,238
3
Beds
1
Bath
1,344
Sq Ft
$259/Sq Ft
Est. Value
About This Home
This home is located at 2967 Iowa Ave, Rowley, IA 52329 and is currently estimated at $348,079, approximately $258 per square foot. 2967 Iowa Ave is a home located in Buchanan County with nearby schools including West Elementary School, East Elementary School, and Independence Junior/Senior High School.
Ownership History
Date
Name
Owned For
Owner Type
Purchase Details
Closed on
Nov 4, 2022
Sold by
Higgins Daryl R and Higgins Alice N
Bought by
Johnson Alexus Anne
Current Estimated Value
Home Financials for this Owner
Home Financials are based on the most recent Mortgage that was taken out on this home.
Original Mortgage
$454,000
Outstanding Balance
$439,266
Interest Rate
6.7%
Mortgage Type
Construction
Estimated Equity
-$91,187
Create a Home Valuation Report for This Property
The Home Valuation Report is an in-depth analysis detailing your home's value as well as a comparison with similar homes in the area
Home Values in the Area
Average Home Value in this Area
Purchase History
| Date | Buyer | Sale Price | Title Company |
|---|---|---|---|
| Johnson Alexus Anne | $908,500 | -- |
Source: Public Records
Mortgage History
| Date | Status | Borrower | Loan Amount |
|---|---|---|---|
| Open | Johnson Alexus Anne | $454,000 |
Source: Public Records
Tax History Compared to Growth
Tax History
| Year | Tax Paid | Tax Assessment Tax Assessment Total Assessment is a certain percentage of the fair market value that is determined by local assessors to be the total taxable value of land and additions on the property. | Land | Improvement |
|---|---|---|---|---|
| 2025 | $5,124 | $378,960 | $89,300 | $289,660 |
| 2024 | $5,124 | $287,880 | $72,490 | $215,390 |
| 2023 | $4,948 | $287,880 | $72,490 | $215,390 |
| 2022 | $4,056 | $199,140 | $58,310 | $140,830 |
| 2021 | $3,808 | $199,140 | $58,310 | $140,830 |
| 2020 | $3,808 | $184,980 | $53,470 | $131,510 |
| 2019 | $1,704 | $98,310 | $53,470 | $44,840 |
| 2018 | $1,496 | $110,780 | $76,340 | $34,440 |
| 2017 | $2,384 | $104,460 | $76,340 | $28,120 |
| 2016 | $2,162 | $174,658 | $85,820 | $88,838 |
| 2015 | $2,162 | $174,658 | $85,820 | $88,838 |
| 2014 | $2,182 | $174,105 | $83,400 | $90,705 |
Source: Public Records
Map
Nearby Homes