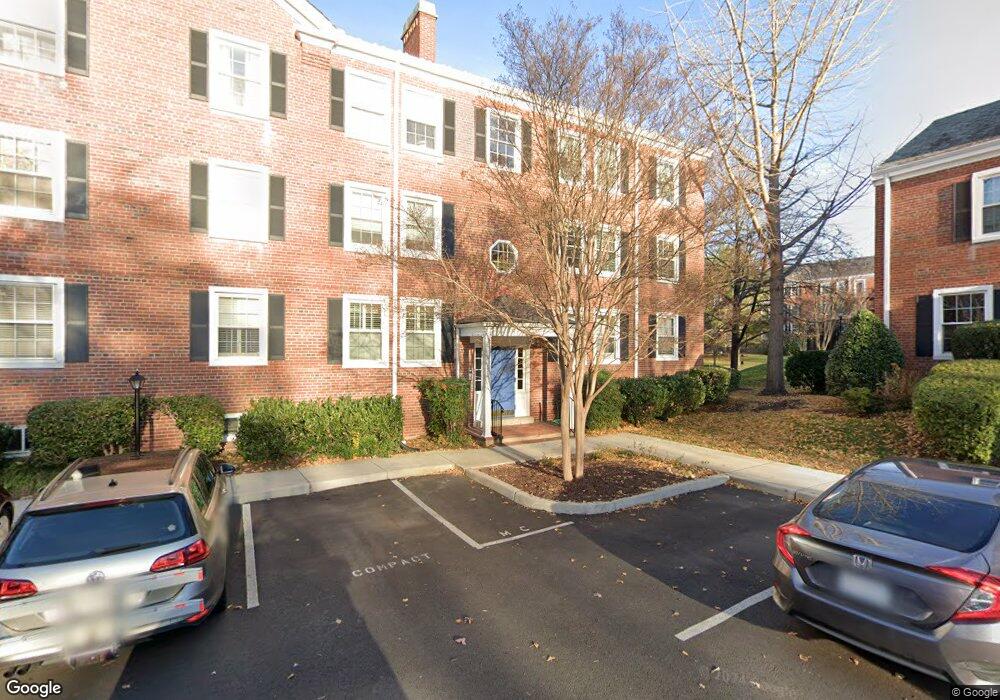
2967 S Columbus St Unit B1 Arlington, VA 22206
Fairlington NeighborhoodEstimated Value: $328,407 - $396,000
1
Bed
1
Bath
711
Sq Ft
$491/Sq Ft
Est. Value
About This Home
This home is located at 2967 S Columbus St Unit B1, Arlington, VA 22206 and is currently estimated at $348,852, approximately $490 per square foot. 2967 S Columbus St Unit B1 is a home located in Arlington County with nearby schools including Gunston Middle School, Wakefield High School, and Guidepost Montessori at West Alex.
Ownership History
Date
Name
Owned For
Owner Type
Purchase Details
Closed on
Aug 10, 2004
Sold by
Koutsoukos George
Bought by
Brooks Robert
Current Estimated Value
Home Financials for this Owner
Home Financials are based on the most recent Mortgage that was taken out on this home.
Original Mortgage
$228,649
Outstanding Balance
$113,610
Interest Rate
6.03%
Mortgage Type
New Conventional
Estimated Equity
$235,242
Purchase Details
Closed on
Jan 8, 2004
Sold by
Divine David
Bought by
Koutsoukos George
Home Financials for this Owner
Home Financials are based on the most recent Mortgage that was taken out on this home.
Original Mortgage
$190,600
Interest Rate
5.88%
Mortgage Type
FHA
Purchase Details
Closed on
Dec 20, 2000
Sold by
Packo Ann Marie
Bought by
Divine David A
Home Financials for this Owner
Home Financials are based on the most recent Mortgage that was taken out on this home.
Original Mortgage
$96,903
Interest Rate
7.71%
Create a Home Valuation Report for This Property
The Home Valuation Report is an in-depth analysis detailing your home's value as well as a comparison with similar homes in the area
Home Values in the Area
Average Home Value in this Area
Purchase History
| Date | Buyer | Sale Price | Title Company |
|---|---|---|---|
| Brooks Robert | $249,500 | -- | |
| Koutsoukos George | $195,000 | -- | |
| Divine David A | $99,900 | -- | |
| Koutsoukos George | $195,000 | -- |
Source: Public Records
Mortgage History
| Date | Status | Borrower | Loan Amount |
|---|---|---|---|
| Open | Brooks Robert | $228,649 | |
| Previous Owner | Koutsoukos George | $190,600 | |
| Previous Owner | Divine David A | $96,903 | |
| Closed | Koutsoukos George | $190,600 |
Source: Public Records
Tax History Compared to Growth
Tax History
| Year | Tax Paid | Tax Assessment Tax Assessment Total Assessment is a certain percentage of the fair market value that is determined by local assessors to be the total taxable value of land and additions on the property. | Land | Improvement |
|---|---|---|---|---|
| 2025 | $3,242 | $313,800 | $41,200 | $272,600 |
| 2024 | $3,162 | $306,100 | $41,200 | $264,900 |
| 2023 | $3,153 | $306,100 | $41,200 | $264,900 |
| 2022 | $3,101 | $301,100 | $41,200 | $259,900 |
| 2021 | $2,978 | $289,100 | $37,200 | $251,900 |
| 2020 | $2,780 | $271,000 | $37,200 | $233,800 |
| 2019 | $2,558 | $249,300 | $34,100 | $215,200 |
| 2018 | $2,457 | $244,200 | $34,100 | $210,100 |
| 2017 | $2,397 | $238,300 | $34,100 | $204,200 |
| 2016 | $2,269 | $229,000 | $34,100 | $194,900 |
| 2015 | $2,281 | $229,000 | $34,100 | $194,900 |
| 2014 | $2,192 | $220,100 | $34,100 | $186,000 |
Source: Public Records
Map
Nearby Homes
- 2949 S Columbus St Unit A2
- 4836 29th St S Unit A1
- 2950 S Columbus St Unit C1
- 2990 S Columbus St
- 3017 S Columbus St Unit A1
- 3000 S Columbus St Unit B2
- 2842 S Columbus St
- 3315 Wyndham Cir Unit 1223
- 3049 S Buchanan St Unit B2
- 3050 S Buchanan St Unit A2
- 3310 Wyndham Cir Unit 215
- 3101 N Hampton Dr Unit 407
- 4879 28th St S Unit A
- 3080 S Abingdon St Unit A1
- 4551 Strutfield Ln Unit 4111
- 4551 Strutfield Ln Unit 4337
- 3311 Wyndham Cir Unit 1193
- 4520 King St Unit 601
- 4600 30th Rd S
- 3210 S 28th St Unit 404
- 2967 S Columbus St Unit A2
- 2967 S Columbus St Unit C2
- 2967 S Columbus St Unit C1
- 2967 S Columbus St Unit A1
- 2965 S Columbus St Unit B2
- 2965 S Columbus St Unit A1
- 2965 S Columbus St Unit A2
- 2965 S Columbus St Unit C2
- 2965 S Columbus St Unit C1
- 2965 S Columbus St Unit B1
- 2969 S Columbus St
- 2971 S Columbus St Unit A1
- 2971 S Columbus St Unit B1
- 2971 S Columbus St Unit C1
- 2971 S Columbus St Unit C2
- 2971 S Columbus St Unit B2
- 2971 S Columbus St Unit A2
- 2963 S Columbus St
- 2928 S Buchanan St Unit C1
- 2928 S Buchanan St Unit A2