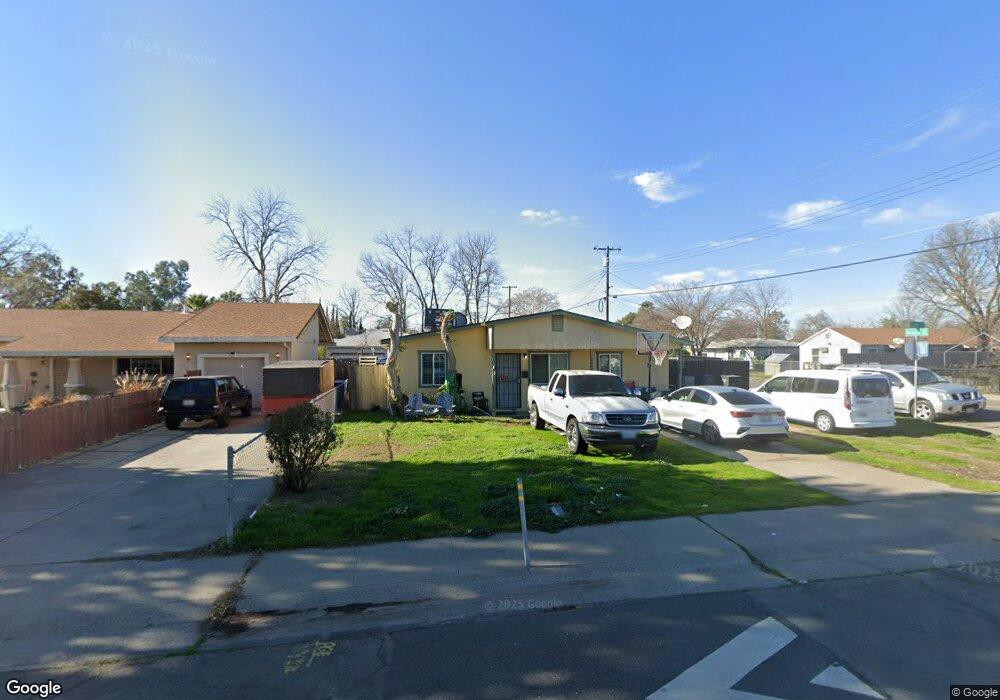
2969 Clay St Sacramento, CA 95815
South Hagginwood NeighborhoodEstimated Value: $237,000 - $353,000
3
Beds
2
Baths
1,212
Sq Ft
$262/Sq Ft
Est. Value
About This Home
This home is located at 2969 Clay St, Sacramento, CA 95815 and is currently estimated at $317,448, approximately $261 per square foot. 2969 Clay St is a home located in Sacramento County with nearby schools including Hagginwood Elementary School, Martin Luther King Jr. Technology Academy, and Grant Union High School.
Ownership History
Date
Name
Owned For
Owner Type
Purchase Details
Closed on
Jul 16, 2022
Sold by
Khushal Patel Jayantibhai and Khushal Jayant Nutan
Bought by
Jay And Nutan Patel Family Trust
Current Estimated Value
Purchase Details
Closed on
Nov 14, 2005
Sold by
Patel Nutan J
Bought by
Patel Jayantibahi K
Home Financials for this Owner
Home Financials are based on the most recent Mortgage that was taken out on this home.
Original Mortgage
$193,000
Interest Rate
6.87%
Mortgage Type
Purchase Money Mortgage
Create a Home Valuation Report for This Property
The Home Valuation Report is an in-depth analysis detailing your home's value as well as a comparison with similar homes in the area
Home Values in the Area
Average Home Value in this Area
Purchase History
| Date | Buyer | Sale Price | Title Company |
|---|---|---|---|
| Jay And Nutan Patel Family Trust | -- | None Listed On Document | |
| Patel Jayantibhai Khushal | -- | None Listed On Document | |
| Patel Jayantibahi K | -- | Commonwealth Land Title Co |
Source: Public Records
Mortgage History
| Date | Status | Borrower | Loan Amount |
|---|---|---|---|
| Previous Owner | Patel Jayantibahi K | $193,000 |
Source: Public Records
Tax History Compared to Growth
Tax History
| Year | Tax Paid | Tax Assessment Tax Assessment Total Assessment is a certain percentage of the fair market value that is determined by local assessors to be the total taxable value of land and additions on the property. | Land | Improvement |
|---|---|---|---|---|
| 2025 | $975 | $66,821 | $11,753 | $55,068 |
| 2024 | $975 | $65,512 | $11,523 | $53,989 |
| 2023 | $976 | $64,229 | $11,298 | $52,931 |
| 2022 | $927 | $62,971 | $11,077 | $51,894 |
| 2021 | $920 | $61,737 | $10,860 | $50,877 |
| 2020 | $910 | $61,105 | $10,749 | $50,356 |
| 2019 | $898 | $59,908 | $10,539 | $49,369 |
| 2018 | $856 | $58,734 | $10,333 | $48,401 |
| 2017 | $874 | $57,583 | $10,131 | $47,452 |
| 2016 | $831 | $56,455 | $9,933 | $46,522 |
| 2015 | $782 | $55,608 | $9,784 | $45,824 |
| 2014 | $796 | $54,520 | $9,593 | $44,927 |
Source: Public Records
Map
Nearby Homes
- 1124 Acacia Ave
- 2980 Marysville Blvd
- 2917 Del Paso Blvd
- 1059 Acacia Ave
- 1021 Alamos Ave
- 967 Olive Branch Place
- 974 Acacia Ave
- 2944 Del Paso Blvd
- 3090 Marysville Blvd
- 2781 Clay St
- 1015 Arcade Blvd
- 999 Arcade Blvd
- 1528 Sonoma Ave
- 2829 Rio Linda Blvd
- 2844 Amaranth Alley
- 1331 Diamond Ave
- 1512 Kathleen Ave
- 940 Rivera Dr
- 1113 Rivera Dr
- 2729 Rio Linda Blvd