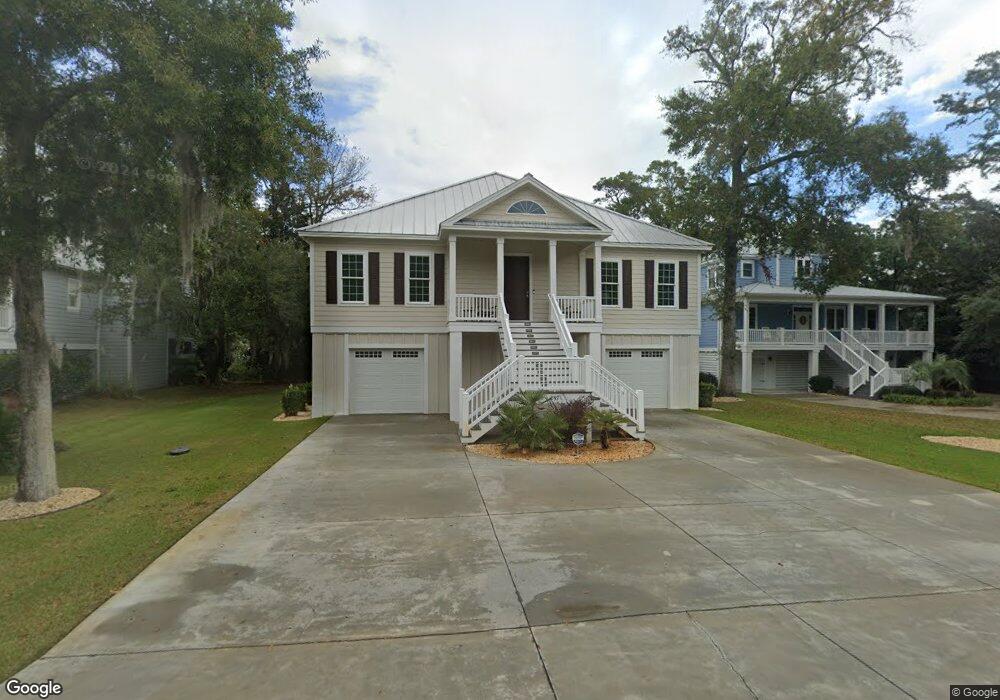
297 Cayman Loop Pawleys Island, SC 29585
Estimated Value: $1,041,000 - $1,222,000
4
Beds
3
Baths
2,742
Sq Ft
$402/Sq Ft
Est. Value
About This Home
This home is located at 297 Cayman Loop, Pawleys Island, SC 29585 and is currently estimated at $1,101,253, approximately $401 per square foot. 297 Cayman Loop is a home with nearby schools including Waccamaw Elementary School, Waccamaw Intermediate School, and Waccamaw Middle School.
Ownership History
Date
Name
Owned For
Owner Type
Purchase Details
Closed on
May 13, 2016
Sold by
Fowler Robert M and Fowler April B
Bought by
Baker Dale W and Baker Victoria M
Current Estimated Value
Purchase Details
Closed on
Jun 26, 2015
Sold by
Truluck Carl L and Truluck Janet E
Bought by
Fowler Robert M and Fowler April B
Home Financials for this Owner
Home Financials are based on the most recent Mortgage that was taken out on this home.
Original Mortgage
$388,000
Interest Rate
5.5%
Mortgage Type
Construction
Purchase Details
Closed on
Nov 23, 2009
Sold by
Estate Of Elizabeth G Truluck and Truluck Carl L
Bought by
Truluck Carl L and Truluck Janet E
Purchase Details
Closed on
Aug 15, 2001
Sold by
Waccamaw Trace Llc
Bought by
Truluck Elizabeth G
Purchase Details
Closed on
Jun 29, 2001
Sold by
Cato Homes Inc
Bought by
Clifton Kenneth E
Purchase Details
Closed on
May 12, 2000
Sold by
Waccamaw Trace Llc
Bought by
Cato Homes Inc
Create a Home Valuation Report for This Property
The Home Valuation Report is an in-depth analysis detailing your home's value as well as a comparison with similar homes in the area
Home Values in the Area
Average Home Value in this Area
Purchase History
| Date | Buyer | Sale Price | Title Company |
|---|---|---|---|
| Baker Dale W | $171,250 | -- | |
| Fowler Robert M | $174,600 | -- | |
| Truluck Carl L | -- | -- | |
| Truluck Elizabeth G | $185,000 | -- | |
| Clifton Kenneth E | $300,000 | -- | |
| Cato Homes Inc | $90,000 | -- |
Source: Public Records
Mortgage History
| Date | Status | Borrower | Loan Amount |
|---|---|---|---|
| Previous Owner | Fowler Robert M | $388,000 |
Source: Public Records
Tax History Compared to Growth
Tax History
| Year | Tax Paid | Tax Assessment Tax Assessment Total Assessment is a certain percentage of the fair market value that is determined by local assessors to be the total taxable value of land and additions on the property. | Land | Improvement |
|---|---|---|---|---|
| 2024 | $2,693 | $22,790 | $6,000 | $16,790 |
| 2023 | $2,693 | $22,790 | $6,000 | $16,790 |
| 2022 | $2,474 | $22,790 | $6,000 | $16,790 |
| 2021 | $2,395 | $22,788 | $6,000 | $16,788 |
| 2020 | $2,389 | $22,788 | $6,000 | $16,788 |
| 2019 | $2,339 | $22,544 | $6,400 | $16,144 |
| 2018 | $2,613 | $225,440 | $0 | $0 |
| 2017 | $1,504 | $145,320 | $0 | $0 |
| 2016 | $2,385 | $11,400 | $0 | $0 |
| 2015 | -- | $0 | $0 | $0 |
| 2014 | -- | $200,000 | $200,000 | $0 |
| 2012 | -- | $200,000 | $200,000 | $0 |
Source: Public Records
Map
Nearby Homes
- 270 N Boyle Dr Unit Waccamaw Trace
- 141 Cayman Loop
- 147 Litchfield Landings Unit Lot 3 litchfield lan
- 14500 Ocean Hwy Unit Parcel B Litchfield
- 0 Jason Dr Unit known as Jason Dr. a
- 0 Jason Dr Unit 2507684
- 14290 Ocean Hwy Unit 320
- 14290 Ocean Hwy Unit 201
- 14290 Ocean Hwy Unit 324
- 14290 Ocean Hwy Unit 220
- 14290 Ocean Hwy Unit 207
- 14290 Ocean Hwy Unit 211
- 216 Parker Dr
- 362 Retreat Beach Cir
- 113 Lakeside Dr Unit A
- 436 Parker Dr
- 130 Ancient Mariner Ln
- 39 Blue Crab Way Unit 21
- Portion Wall St
- 601 Retreat Beach Cir Unit 521
- Lot 51 Waccamaw Trace
- 52 Cayman Loop
- 52 Cayman Loop
- 52 Cayman Loop Unit LOT 9 WACCAMAW TRAC
- 52 Cayman Loop Unit Lot 52
- 311 Cayman Loop
- 327 Cayman Loop
- 284 Cayman Loop
- 270 N Boyle Dr
- 244 N Boyle Dr
- 298 Cayman Loop
- 243 Cayman Loop
- 243 Cayman Loop Unit Waccamaw Trace
- 243 Cayman Loop Unit Lot 48
- 251 Cayman Loop
- 272 Cayman Loop Unit Waccamaw Trace
- 272 Cayman Loop
- LOT 41 A Cayman Loop
- LOT 11 Cayman Loop Unit WACCAMAW TRACE, NORT
- LOT 29 Schooner Ct Unit Waccamaw Trace