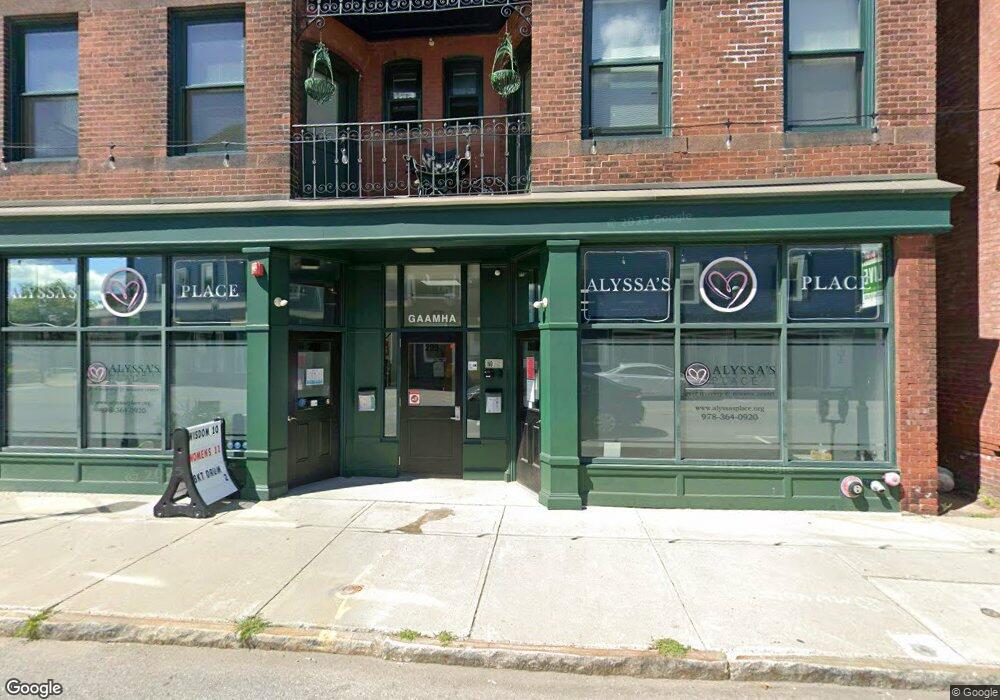
297 Central St Unit 301 Gardner, MA 01440
Estimated Value: $665,721
5
Beds
10
Baths
7,220
Sq Ft
$92/Sq Ft
Est. Value
About This Home
This home is located at 297 Central St Unit 301, Gardner, MA 01440 and is currently estimated at $665,721, approximately $92 per square foot. 297 Central St Unit 301 is a home located in Worcester County with nearby schools including Gardner High School, Holy Family Academy, and Wachusett Hills Christian School.
Ownership History
Date
Name
Owned For
Owner Type
Purchase Details
Closed on
Jun 30, 2016
Sold by
Gardner Athol Area Men
Bought by
Gaamha Inc
Current Estimated Value
Purchase Details
Closed on
May 5, 2016
Sold by
Menear Jon S
Bought by
Gardner-Athol Area Men
Purchase Details
Closed on
Sep 13, 2004
Sold by
B&B Rt and Boudreau David T
Bought by
Menear Deborah L and Menear Jon S
Home Financials for this Owner
Home Financials are based on the most recent Mortgage that was taken out on this home.
Original Mortgage
$250,000
Interest Rate
6.08%
Mortgage Type
Commercial
Purchase Details
Closed on
Jun 24, 1994
Sold by
Recoll Mamangement Co
Bought by
Leblanc Steven P and Boone James
Purchase Details
Closed on
Dec 21, 1990
Sold by
Greenwood Rt
Bought by
Phnb Realty Inc
Create a Home Valuation Report for This Property
The Home Valuation Report is an in-depth analysis detailing your home's value as well as a comparison with similar homes in the area
Home Values in the Area
Average Home Value in this Area
Purchase History
| Date | Buyer | Sale Price | Title Company |
|---|---|---|---|
| Gaamha Inc | -- | -- | |
| Gardner-Athol Area Men | $95,000 | -- | |
| Menear Deborah L | $335,000 | -- | |
| Leblanc Steven P | $60,000 | -- | |
| Phnb Realty Inc | $214,000 | -- |
Source: Public Records
Mortgage History
| Date | Status | Borrower | Loan Amount |
|---|---|---|---|
| Previous Owner | Menear Deborah L | $250,000 | |
| Previous Owner | Phnb Realty Inc | $220,000 | |
| Previous Owner | Phnb Realty Inc | $100,000 | |
| Previous Owner | Phnb Realty Inc | $275,000 |
Source: Public Records
Tax History Compared to Growth
Tax History
| Year | Tax Paid | Tax Assessment Tax Assessment Total Assessment is a certain percentage of the fair market value that is determined by local assessors to be the total taxable value of land and additions on the property. | Land | Improvement |
|---|---|---|---|---|
| 2025 | $0 | $521,600 | $46,300 | $475,300 |
| 2024 | $5,126 | $384,600 | $57,500 | $327,100 |
| 2023 | $5,126 | $362,000 | $43,900 | $318,100 |
| 2022 | $5,126 | $268,600 | $38,200 | $230,400 |
| 2021 | $5,126 | $268,600 | $38,200 | $230,400 |
| 2020 | -- | $268,600 | $38,200 | $230,400 |
| 2019 | -- | $268,600 | $38,200 | $230,400 |
| 2018 | $5,126 | $268,600 | $38,200 | $230,400 |
| 2017 | $5,126 | $250,400 | $36,400 | $214,000 |
| 2016 | $5,126 | $250,400 | $36,400 | $214,000 |
| 2015 | $5,003 | $250,400 | $36,400 | $214,000 |
| 2014 | $4,976 | $263,700 | $41,400 | $222,300 |
Source: Public Records
Map
Nearby Homes
- 307 Central St
- 309 Central St
- 280 Central St Unit 302
- 280-302 Central St
- 271 Central St
- 271-277 Central St
- 316 Central St
- 310 Central St Unit 320
- 310-320 Central St
- 4 W Lynde St
- 55 Vernon St
- 0 Main St
- 32 Vernon St
- 14 Richmond St
- 404244 Main St
- 42 Vernon St
- 29 Parker St
- 50 Vernon St Unit 2
- 50 Vernon St Unit 1
- 50 Vernon St