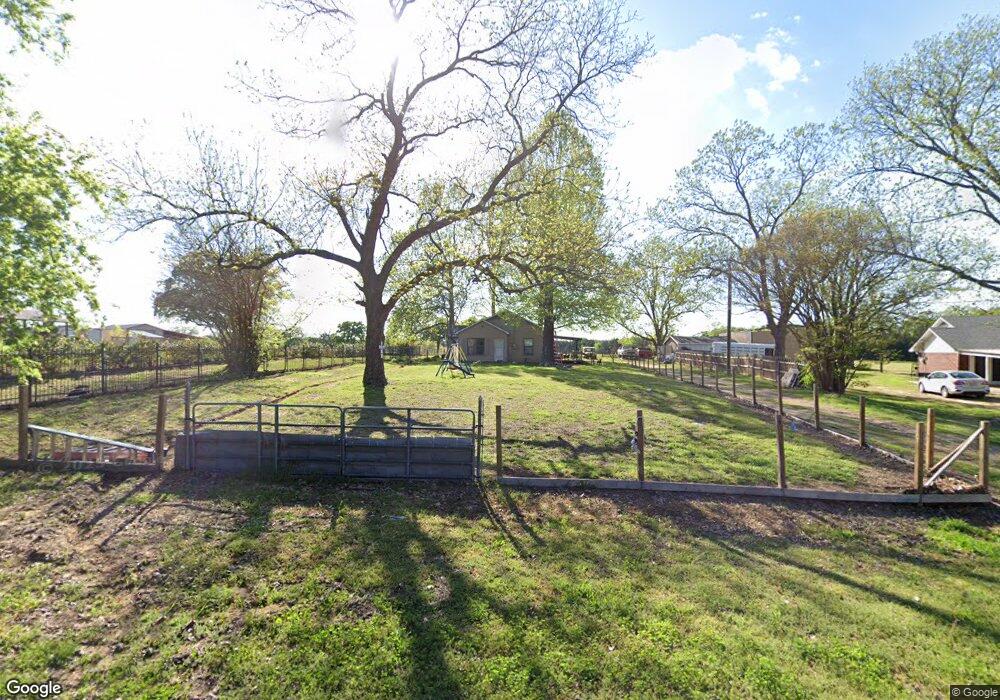
297 Coe Rd Denison, TX 75021
Estimated Value: $230,288 - $324,000
Studio
--
Bath
1,619
Sq Ft
$171/Sq Ft
Est. Value
About This Home
This home is located at 297 Coe Rd, Denison, TX 75021 and is currently estimated at $277,144, approximately $171 per square foot. 297 Coe Rd is a home located in Grayson County with nearby schools including Lamar Elementary School, Scott Middle School, and Denison High School.
Ownership History
Date
Name
Owned For
Owner Type
Purchase Details
Closed on
Mar 21, 2022
Sold by
Powless Sonia E
Bought by
Powless Brendan M
Current Estimated Value
Home Financials for this Owner
Home Financials are based on the most recent Mortgage that was taken out on this home.
Original Mortgage
$55,300
Outstanding Balance
$44,786
Interest Rate
3.39%
Mortgage Type
New Conventional
Estimated Equity
$232,358
Purchase Details
Closed on
Jan 28, 2009
Sold by
Lohr Tom and Lohr Angela
Bought by
Powless Sonia E and Powless Steven E
Purchase Details
Closed on
Aug 24, 2006
Sold by
Lowery John T and Lowery Marion L
Bought by
Powless Steve E and Powless Sonia E
Home Financials for this Owner
Home Financials are based on the most recent Mortgage that was taken out on this home.
Original Mortgage
$78,271
Interest Rate
6.72%
Mortgage Type
FHA
Create a Home Valuation Report for This Property
The Home Valuation Report is an in-depth analysis detailing your home's value as well as a comparison with similar homes in the area
Home Values in the Area
Average Home Value in this Area
Purchase History
| Date | Buyer | Sale Price | Title Company |
|---|---|---|---|
| Powless Brendan M | -- | Red River Title | |
| Powless Sonia E | -- | Security Title | |
| Powless Steve E | -- | None Available |
Source: Public Records
Mortgage History
| Date | Status | Borrower | Loan Amount |
|---|---|---|---|
| Open | Powless Brendan M | $55,300 | |
| Previous Owner | Powless Steve E | $78,271 |
Source: Public Records
Tax History
| Year | Tax Paid | Tax Assessment Tax Assessment Total Assessment is a certain percentage of the fair market value that is determined by local assessors to be the total taxable value of land and additions on the property. | Land | Improvement |
|---|---|---|---|---|
| 2025 | $1,796 | $180,819 | $50,483 | $130,336 |
| 2024 | $3,073 | $190,257 | $47,002 | $143,255 |
| 2023 | $1,612 | $178,261 | $47,002 | $131,259 |
| 2022 | $2,186 | $126,540 | $0 | $0 |
| 2021 | $2,157 | $115,036 | $21,733 | $93,303 |
| 2020 | $2,182 | $109,587 | $15,039 | $94,548 |
| 2019 | $2,133 | $106,108 | $15,039 | $91,069 |
| 2018 | $1,959 | $91,284 | $13,056 | $78,228 |
| 2017 | $1,935 | $89,574 | $13,056 | $76,518 |
| 2016 | $1,845 | $85,383 | $12,322 | $73,061 |
Source: Public Records
Map
Nearby Homes
- 1846 Richerson Rd
- 2757 Fm 1753
- TBD NE Fm 1753 & Singletree
- 1838 Richerson Rd
- Vacant Land Ledbetter Ln
- TBD Ledbetter Ln
- TBD Singletree Rd
- TBD E Fm 120
- 5.92 Rd
- 40 Cumberland Cir
- 566 Mccraw Ln
- 194 Middle Rd
- 492 Richerson Rd
- TBD Johnson Rd
- 1549 Starr Rd
- 230 Frosty Hollow Rd
- TBD Cross Timber Estates Dr
- 1912 E Texas St
- 21 Chaparral Estates Dr
- TBD N Highway 69
Your Personal Tour Guide
Ask me questions while you tour the home.