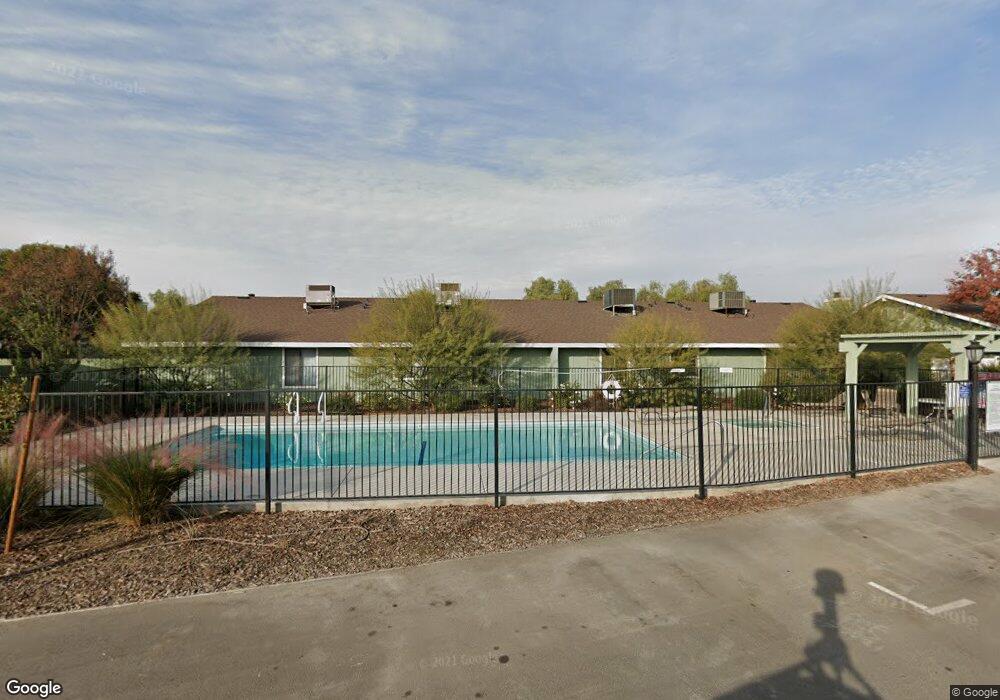
297 E Bullard Ave Unit 127 Fresno, CA 93710
Hoover NeighborhoodEstimated Value: $216,247 - $254,000
3
Beds
2
Baths
1,176
Sq Ft
$206/Sq Ft
Est. Value
About This Home
This home is located at 297 E Bullard Ave Unit 127, Fresno, CA 93710 and is currently estimated at $241,812, approximately $205 per square foot. 297 E Bullard Ave Unit 127 is a home located in Fresno County with nearby schools including Robinson Elementary School, Ahwahnee Middle School, and Herbert Hoover High School.
Ownership History
Date
Name
Owned For
Owner Type
Purchase Details
Closed on
Jan 21, 2009
Sold by
Deutsche Bank National Trust Company
Bought by
Deel Michael C and Deel Amalia C
Current Estimated Value
Purchase Details
Closed on
May 21, 2008
Sold by
Channita Keung
Bought by
Deutsche Bank National Trust Co and Argent Securities Inc Asset Backed Pass
Purchase Details
Closed on
Mar 9, 2006
Sold by
Delazari Michael
Bought by
Channita Keung
Home Financials for this Owner
Home Financials are based on the most recent Mortgage that was taken out on this home.
Original Mortgage
$171,600
Interest Rate
8.25%
Mortgage Type
Purchase Money Mortgage
Purchase Details
Closed on
Sep 21, 2000
Sold by
Ramirez David
Bought by
Delazari Michael
Home Financials for this Owner
Home Financials are based on the most recent Mortgage that was taken out on this home.
Original Mortgage
$58,200
Interest Rate
7.86%
Mortgage Type
FHA
Purchase Details
Closed on
Aug 21, 1996
Sold by
Standfuss Frank F and Standfuss Frank R
Bought by
Ramirez David
Create a Home Valuation Report for This Property
The Home Valuation Report is an in-depth analysis detailing your home's value as well as a comparison with similar homes in the area
Home Values in the Area
Average Home Value in this Area
Purchase History
| Date | Buyer | Sale Price | Title Company |
|---|---|---|---|
| Deel Michael C | $83,000 | Chicago Title Company | |
| Deutsche Bank National Trust Co | $135,000 | Cr Title Services Inc | |
| Channita Keung | $214,500 | Chicago Title Company | |
| Delazari Michael | $60,000 | Chicago Title Co | |
| Ramirez David | $56,500 | Central Title Company |
Source: Public Records
Mortgage History
| Date | Status | Borrower | Loan Amount |
|---|---|---|---|
| Previous Owner | Channita Keung | $171,600 | |
| Previous Owner | Delazari Michael | $58,200 | |
| Closed | Delazari Michael | $1,800 |
Source: Public Records
Tax History Compared to Growth
Tax History
| Year | Tax Paid | Tax Assessment Tax Assessment Total Assessment is a certain percentage of the fair market value that is determined by local assessors to be the total taxable value of land and additions on the property. | Land | Improvement |
|---|---|---|---|---|
| 2025 | $1,348 | $106,865 | $25,745 | $81,120 |
| 2023 | $1,322 | $102,718 | $24,747 | $77,971 |
| 2022 | $1,304 | $100,705 | $24,262 | $76,443 |
| 2021 | $1,269 | $98,732 | $23,787 | $74,945 |
| 2020 | $1,263 | $97,721 | $23,544 | $74,177 |
| 2019 | $1,215 | $95,806 | $23,083 | $72,723 |
| 2018 | $1,189 | $93,929 | $22,631 | $71,298 |
| 2017 | $1,169 | $92,088 | $22,188 | $69,900 |
| 2016 | $1,131 | $90,283 | $21,753 | $68,530 |
| 2015 | $1,114 | $88,928 | $21,427 | $67,501 |
| 2014 | $1,093 | $87,187 | $21,008 | $66,179 |
Source: Public Records
Map
Nearby Homes
- 297 E Bullard Ave Unit 135
- 303 E Bullard Ave Unit 121
- 303 E Bullard Ave Unit 122
- 303 E Bullard Ave Unit 151
- 131 E Mesa Ave
- 144 E Mesa Ave
- 464 E Calimyrna Ave
- 5676 N Callisch Ave
- 5761 N Orchard St
- 5495 N Callisch Ave
- 6171 N Calaveras St
- 467 E San Bruno Ave
- 5549 N Del Mar Ave
- 786 E Dovewood Ln
- 198 W Barstow Ave Unit A
- 6284 N Del Mar Ave
- 6316 N Poplar Ave
- 5186 N Callisch Ave
- 60 W Sierra Ave Unit 102
- 745 E Tenaya Way
- 297 E Bullard Ave
- 297 E Bullard Ave Unit 107
- 297 E Bullard Ave Unit 106
- 297 E Bullard Ave Unit 105
- 297 E Bullard Ave Unit 104
- 297 E Bullard Ave Unit 103
- 297 E Bullard Ave Unit 102
- 297 E Bullard Ave Unit 101
- 297 E Bullard Ave Unit 131
- 297 E Bullard Ave Unit 130
- 297 E Bullard Ave Unit 129
- 297 E Bullard Ave Unit 128
- 297 E Bullard Ave Unit 126
- 297 E Bullard Ave Unit 125
- 297 E Bullard Ave Unit 124
- 297 E Bullard Ave Unit 123
- 297 E Bullard Ave Unit 122
- 297 E Bullard Ave Unit 121
- 297 E Bullard Ave Unit 120
- 297 E Bullard Ave Unit 119